More familiarity with the age-adjustment calculation might be extremely helpful for improving the perspective of many older runners. In this post I apply the “Age Standard Times” from USA Track & Field (USATF) to some Grandma’s marathon results.
A lot of different aspects of human performance have clear patterns of change with aging. For example, there is slowing of various brain processing speeds and decline in reaction times that can be quantified experimentally. I think the Age Standard Times are probably a good estimate of the physiological influence of aging on distance running performance, quantified more conveniently by studying published race results.
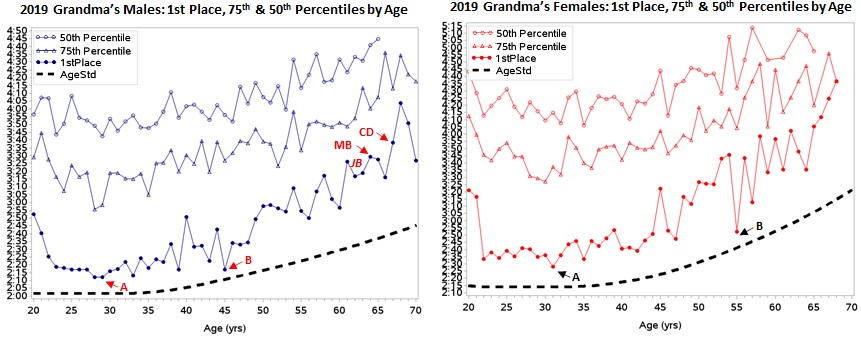
The first set of graphs are a “cross-sectional study” comparing Grandma’s finishing times by one-year age groups. One of my assumptions is that at least part of the differences between groups of runners of different ages probably is about the same as how performance would change for the individual runners in these groups as they progress through the same ages. My other assumption is that in a race field like Grandma’s, most runners with times in the upper end for their one-year age group were well-prepared at race time – that is, they trained hard and were not unusually impaired by something like a recent physical injury, stressful life event, or bad choice for dinner the night before the race (I have heard stories about the last one).
In these graphs I have plotted the finish times for the runner with the fastest (1st place) and the 75th and 50th percentiles of times for their age. Notice that even the fastest older runners tend to finish behind the 75th percentile (top 25%) of younger runners, who represent a lot of runners. Older runners may find this discouraging. (However, a whole lot of younger runners finish behind the better older runners, an occurrence I have heard runners distastefully refer to as “being geezered.”)
The dashed line near the bottom of each graph is the 2020 update of the “Age Standard (AgeStd)” times from the USATF, which are used to generate official age-adjusted times for their Masters Long Distance Running events. Notice how all three plots have a shape that resembles the AgeStd curve. The distance from the dashed AgeStd line corresponds to the age-adjusted time. For both males and females, the overall race winner (marked “A”) was not the age-adjusted winner (“B”).
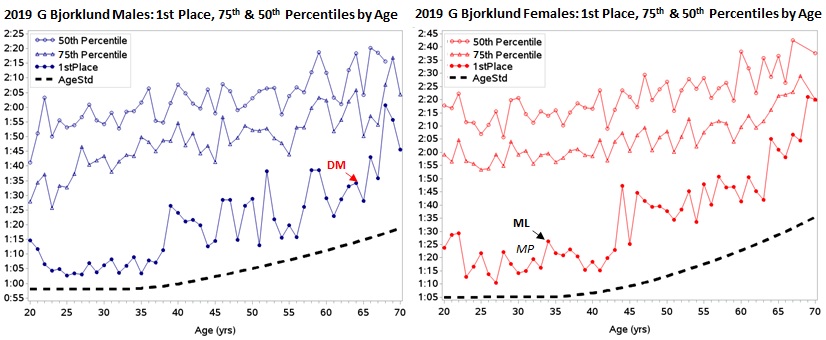
Below these, I also show graphs of 2019 Gary Bjorklund Half Marathon (run on the same day as Grandma’s Marathon using the second half of the Grandma’s race course). Note: the initials in these graphs mark the times for a few of the outstanding runners from our local “running family,” in case any of these folks end up reading this post. (Several of them have recently used this term and it is how I feel about this rather large set of people. More later. I hope they include me in their concept. Perhaps, as an odd older uncle?)
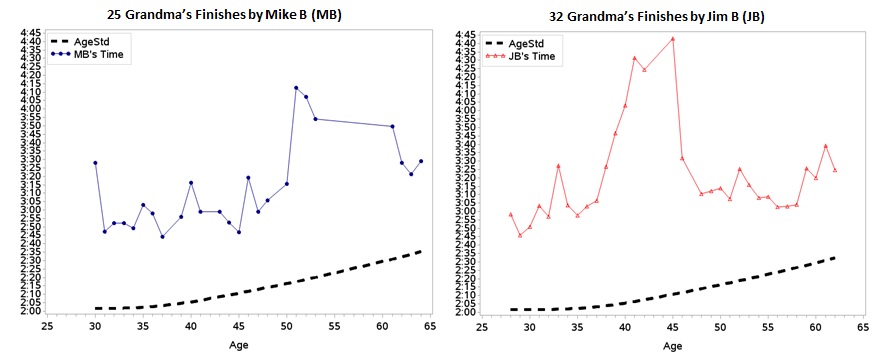
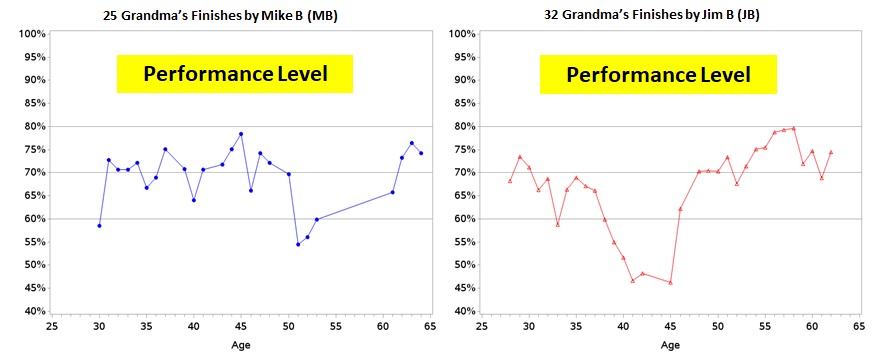
The next set of graphs are a longitudinal study of two outstanding local runners who ran Grandma’s in most of the 35 years from 1985 to 2019: Mike B (25 times), who I know well, and Jim B (32 times), who I do not. Mike was 64 in 2019 and the top finisher among 64-year-old males. Jim was 62 and the second fastest 62-year-old male finisher. The upper graph shows their times plotted by age when ran. The lower graph is their age-adjusted performance level, which is a percentage calculated by dividing the AgeStd time by the runner’s time (a higher percentage is a better performance).
To my eye, both runners’ times roughly resemble the shape of the AgeStd curve, except for a long interval for each runner when they were probably not too happy with their times. I met Mike during the latter part of his not-as-great years and recall he was suffering from various injuries. Mike often speaks wistfully of his speedy days as a young runner when he finished Grandma’s in well under 2:50. (One of Mike’s standard lines when he catches up to the running group after pausing for some reason or other is, “Sorry, I had to change my pacemaker batteries,” which I have interpreted as an expression of sort of the same sentiment.) However, if you look at the second graph, you see that Mike had even better age-adjusted performances, as a geezer, in his last three Grandma’s. Similarly, nearly all of Jim’s runs at age 55 and older were better age-adjusted performances than his also fantastic youngest times.
The creation of the age standard tables is described in detail at: https://github.com/AlanLyttonJones/Age-Grade-Tables. They have a process for compiling world record times by single age and sex. The age standard curves are then defined as a set of “splines” that specify a curve the runs under all the world records. In the graphs below, I just plot the 2020 marathon and half marathon standard times. (Note: I do not know what is up with the weird little segment at the beginning of the female standards, but it is in their tables.)
Note: The best online calculator I have found for plugging in individual times is maintained at: http://howardgrubb.co.uk/athletics/mldrroad20.html.

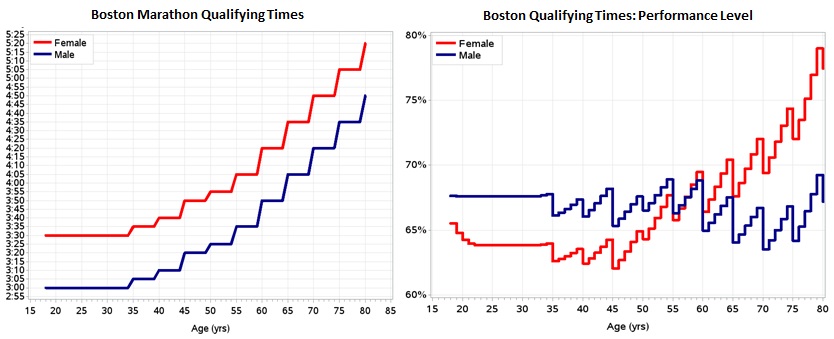
It is hard to overstate the influence of the Boston Marathon qualifying process (getting into this race) on very many amateur runners. There are a lot of reasons for this, including that participating can be an extraordinary experience that is memorable for life (or so I have heard – I have not yet gotten to run in this race). However, it seems to me that what a lot of runners may want most is some sort of visible, official certification that they are (or were) “good” runners, and earning a jacket with the Boston unicorn logo satisfies this.
The Boston Marathon qualifying process essentially uses a version of age standard times to determine who can apply for a race (that is, outside of a separate pathway that generates valuable support for many charities). The extra wrinkle is that the number of qualified applications always exceeds the race capacity and only the fastest qualifying applicants get in. When Boston Marathon announced a tentative plan to have a 2021 race in October but with a greatly reduced number of runners, there were a lot of folks who have qualifying times but were sad to figure out they could not get in with the smaller field size (Happy Aging Runner is one of these).
The graphs below show the current qualifying times and how these translate into performance levels using the 2020 USATF age standards.
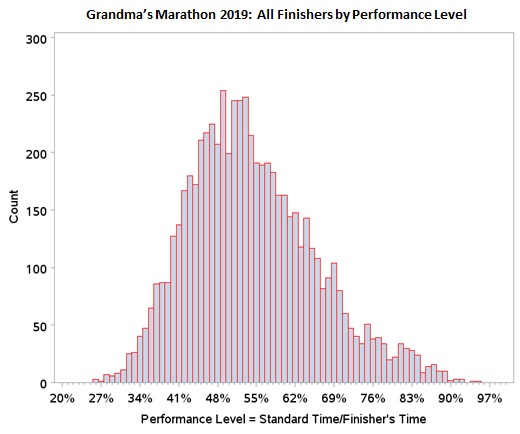
If people had a better understanding of age adjustment, would an official shirt with the runners age-adjusted performance value be almost as good as a jacket with the Boston unicorn? The graph below shows how all finish times (all ages, male and female) from the 2019 Grandma’s can be compared using this single measure.
I have read several times that the best marathon-running (not flying) animal on earth is the ostrich and that an ostrich (or maybe some specific famous ostrich?) can run 26.2 miles in about 75 minutes, which is better than other competitors like the Pronghorn Antelope (way slower). So these official shirts might include a branded drawing of an ostrich to compete with that unicorn.
Addendum 1: Video of ostrich running.
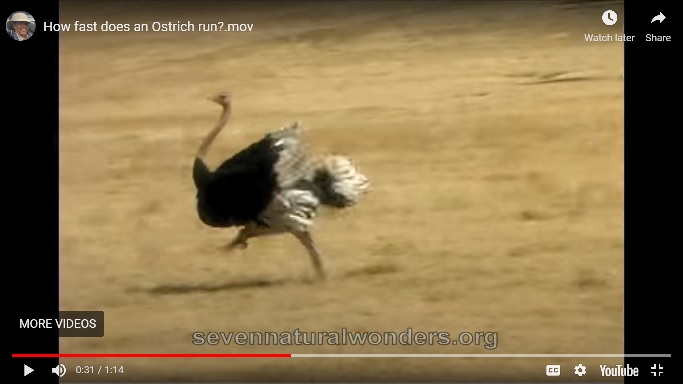
Watch video at: https://tinyurl.com/chm5y7ht. Narrator says they are more than twice as fast as a Roadrunner, therefore, they are probably more than four times as fast as a coyote (or at least Wiley E.) (Note: Another possible new running product would be ostrich-like wings that runners could wear to help with steering at high speed.)
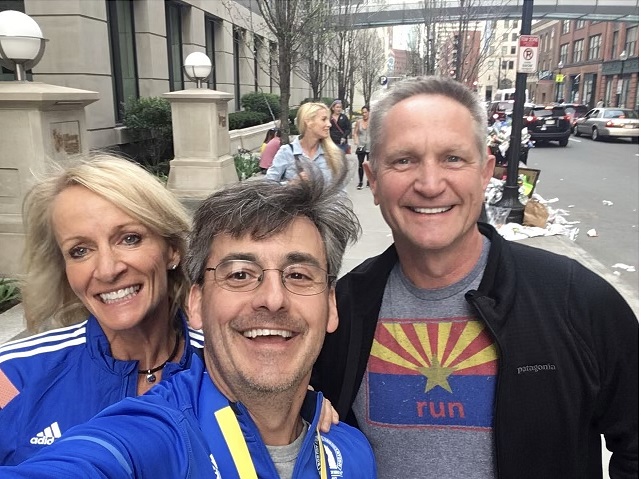
Addendum 2: I mentioned to my running friend Rick T., our Boston Marathon coach, the female Grandma’s Marathon finisher marked “B” in one of my graphs above – the runner who had the overall best age-adjusted time. She is Susan Loken, who, of course, was easy to find online because she is an elite runner with her own running coaching business and a running website that is way more interesting than mine: http://www.believetrainbecome.com/.
Not surprisingly, Rick knows her. He sent me the picture below, showing Susan, Rick, and Susan’s husband, Bill, at the 2017 Boston Marathon.
I think Rick knows everyone. I was running with him two years ago when he flagged down a man running in an outfit that said “Saucony” all over it. Turned out this was Rick’s friend Jacob Frey, Mayor of Minneapolis, who was previously a professional runner sponsored by Saucony

Leave a comment