Friday was a happy one for Happy Aging Runner. Friday, I got the COVID-19 vaccine (the one-shot, Johnson & Johnson version)! Woo-hoo! This makes the idea of being a visitor to Duluth for the June 2021 Grandma’s participant no longer seem so personally reckless!
I celebrated by getting back to trying to learn how to blog. My trial-and-error skills challenge today: posting graphs (I like graphs!). My topic today: How many “older runners” participate in an event like Grandma’s Marathon?
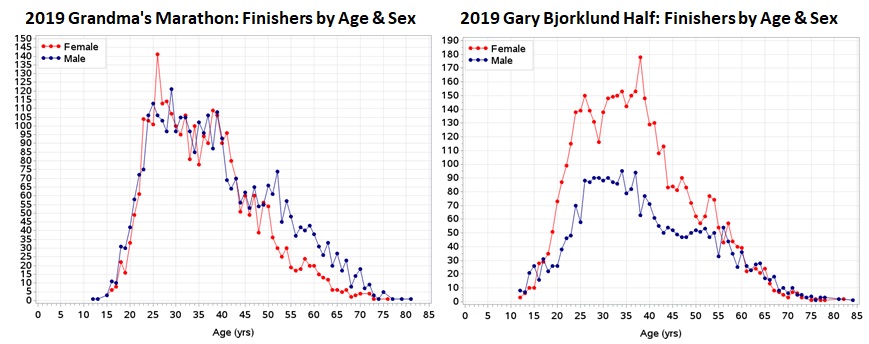
Grandma’s and its companion race, the Gary Bjorklund Half Marathon, publish results online in a way that makes it relatively easy to extract them and do more detailed analyses. The Gary B is run on the southern half the same course but with an earlier start so that no one gets trampled by the elite marathoners. There is no double counting in analyses because no one can run both in the same year. Below is a graph of the age and sex distribution of 2019 finishers in each race.
In Grandma’s, females and males were about equally represented at ages under 50 years whereas in Gary B females were much more abundant under 50. In both races, both genders declined sharply in number at or near age 40, then at about 50 they started an almost linear decline. There were a lot more males over 50 in Grandmas, so it seems likely there were way more Grandpas than Grandmas. (During the registration process they ask whether you are a Grandma, but I could not find anything about responses to this question on the Grandma’s website.)
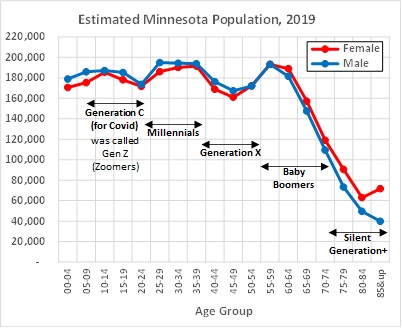
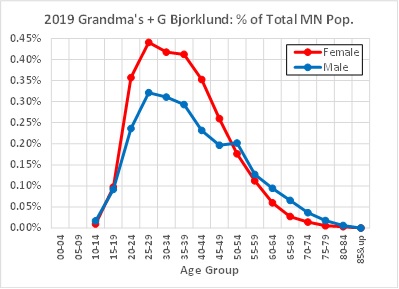
My second pair of graphs describes just the runners who indicated a Minnesota home address: 52% of Grandmas and 76% of Gary B. The first graph shows the estimated Minnesota 2019 population by five-year age groups (from US Census Bureau). The second describes 2019 finishers in these two races (combined) as the percentage of all Minnesota residents by age group. Only the oldest members of Generation C (formerly called Z or Zoomers) participated, the Silent Generation had only a few representatives and the Greatest Generation none. About 0.4% (four per 1,000) of Minnesota’s Millennial women ran vs. about 0.3% of Millennial men. Baby Boomer participation diverged toward more men (for example, about 0.1% in the 60-64 years old male Boomers vs. about 0.06% of the females). I would guess the total number of all Minnesotans by age group who run “a lot” could be estimated using some multiple of this but do not know how what a reasonable factor might be.
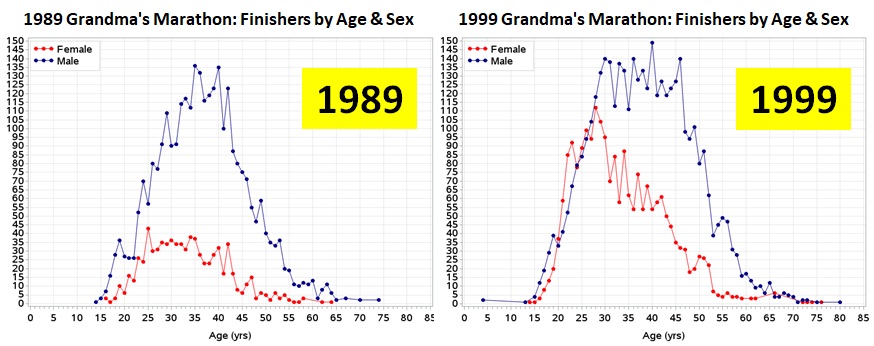
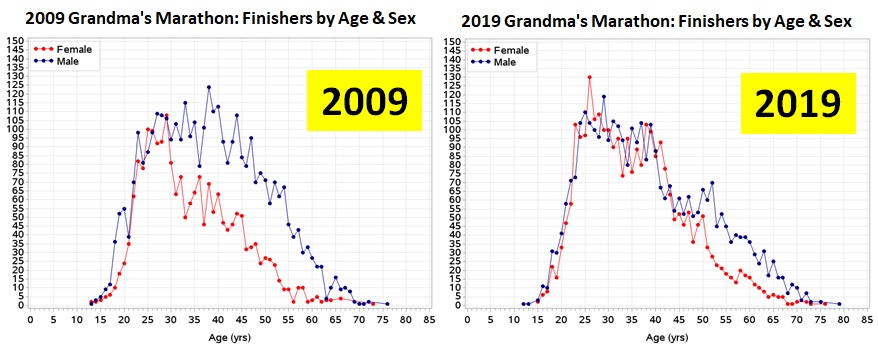
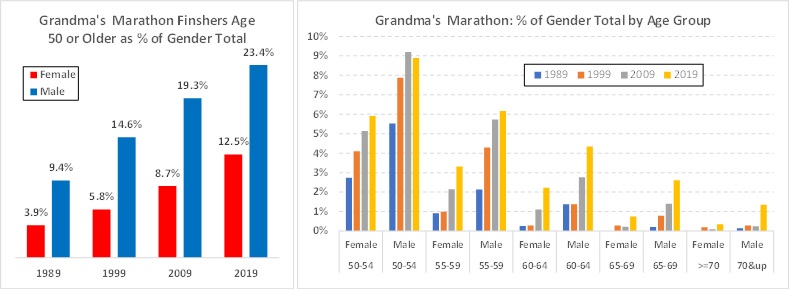
My next set of graphs shows results from four Grandmas (1989, 1999, 2009, and 2019) to look at trends in the distributions of finishers by sex and one-year age groups. Wow, what a change! An invasion of women, with each decade showing relatively more! And the bar graphs below these highlight the invasion of runners in age groups 50 years and older, as well as the steady gain in the relative number of women in each five-year age group older than 50.

Leave a comment