Do I run too much? From conversations (with non-runners, of course) and reading descriptions of what others try to do regularly to maintain their health, I have found that a lot of people believe that “it has been determined” (by wise people who study such things, I guess) that there is an optimal amount of running (or walking or other endurance exercise) to achieve its health benefits and that this amount is way less than the minimum I try to do every week of the year.
- 1. Recommendations from Three Different Perspectives
- 2. Current Official Public Health PA Guidelines
- 3. Absolute Intensity of Aerobic PA
- 4. Relative Intensity of Aerobic PA
- 5. “Wearable Devices” to Measure Absolute & Relative Intensity & Duration of Aerobic PA
- 6. Amounts of PA by Age & Sex in the US Population
- 7. Introduction to Studies Attempting to Quantify the Dose-Response Effects of PA on Health Outcomes
- 8. Dose-Response Association Between PA & All-Cause Mortality, Cardiovascular Disease, and Cancer
- (8a) Garcia 2023: A Meta-analysis 196 Studies of PA & All-Cause Mortality, Cardiovascular Disease, and Cancer
- (8b) Arem 2015: A Very Large Study of PA and All-Cause Mortality
- (8c) Lee 2022: A Study with Better (the Best so Far?) Measurement of Long-term PA
- (8d) How Does PA Lower the Risk of All-Cause Mortality, Cardiovascular Disease, and Cancer?
- 9. Dose-Response Association Between PA & Type 2 Diabetes
- 10. Dose-Response Association Between PA & Depression
- (10A) Importance and Prevalence of Major Depressive Disorder
- (10B) Pearce 2022: A Meta-analysis of 15 Studies of Dose-Response Between Amount of PA & Risk of Depression
- (10C) Laird 2023: Dose-Response Between PA & Depression from “The Irish Longitudinal Study on Aging”
- (10D) Antidepressant Mechanisms of PA
- 11. My Thoughts on the Question, “Have I Maxed Out the Benefits of Aerobic PA?” (No. Physical Fitness Itself as a Positive Health Outcome Associated with PA & Much Opportunity Remains for Me.)
- References
1. Recommendations from Three Different Perspectives
Recommendations about the type and amount of physical activity (PA) one should have to promote health come from different sorts of experts who have different perspectives. These include:
- Coaches. Their perspective is what works well, based on practical experience, for individuals who want to participate and thrive in a “sport.” The running I have done has been based largely on recommendations from this category of experts. I think most of these sorts of experts would not regard the amount of running I do as excessive.
- Teams of experts who generate official public health guidelines.Their perspective is public health — what would improve the health of the population. Examples include guidelines issued by the US Department of Health and Human Services, the UK Chief Medical Officers, and the World Health Organization (WHO). The latest US, UK, and WHO guidelines suggest that nearly maximal health benefits may be obtained from an amount (intensity times duration times frequency) of PA that is far below what very many recreational runners routinely do.
- Medical practitioners and societies. Their perspective is medical patients or people who might become medical patients because of their PA behaviors. Historically, clinicians had a great deal of concern about the risks of vigorous exercise by older (e.g., 45 years and up) individuals.
- Most experts in these roles now recognize the value of PA in preventing or treating numerous medical conditions. Some are exceptionally enthusiastic proponents of exercise.
- However, some retain a lot of concern about adverse effects from (even) the amount of running I do, and even more concern about the very many people who do a lot more. My plan is to discuss this (important to me) topic in my next blog post rather than make this post even longer than I fear it will become.
2. Current Official Public Health PA Guidelines
The official public health-focused PA guidelines listed above have nearly identical recommendations about weekly amounts of (a) aerobic (endurance) exercise; (b) resistance (strength/power) exercise; and (c) for older adults, PA focused on maintaining or improving balance (or stability). I am also extremely interested in (b) and (c) because I am clearly “leaving a lot on the table” in these dimensions. This blog post just discusses endurance exercise. I hope to write about my current efforts to ramp up strength and balance/stability training in a forthcoming post.
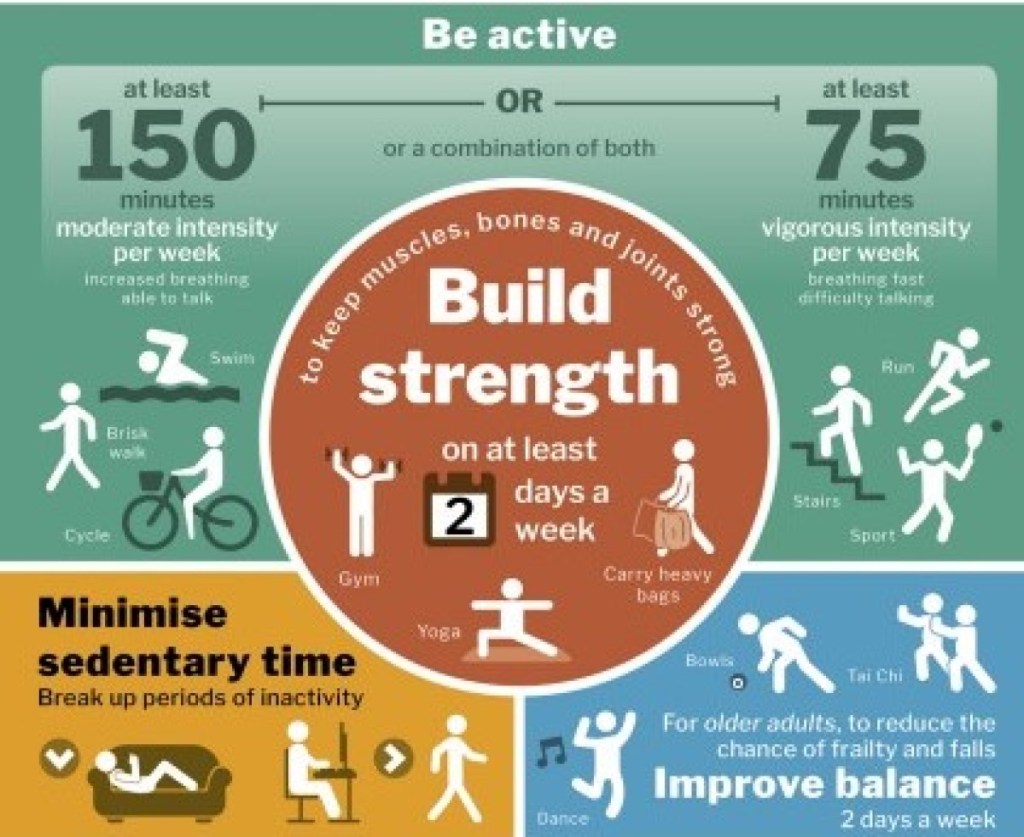
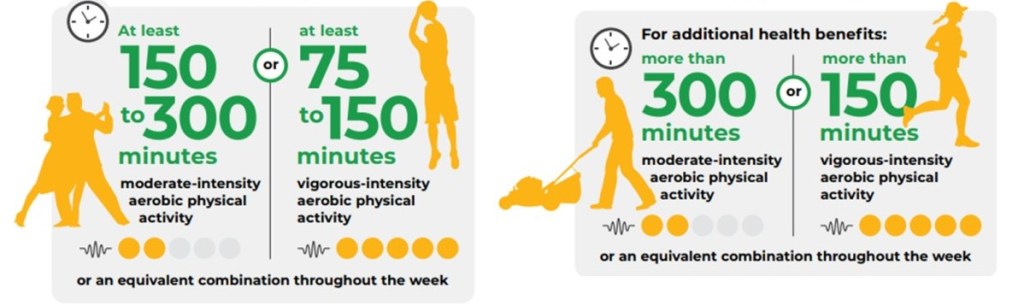
Figures 1 and 2 are from the 2019 UK and 2022 WHO PA guidelines. The UK guidelines recommend at least 150 minutes per week of moderate plus vigorous PA (MVPA) — where MVPA equals moderate intensity minutes + (two times vigorous minutes). The WHO and 2018 US PA guidelines recommend at least 150 to 300 minutes per week of MVPA. References #1 – 3.
In all three guidelines, the levels of intensity that define moderate and vigorous PA are intended to be relative to the individual’s cardiorespiratory fitness (CRF) rather than measures of absolute intensity. An individual with higher CRF may need PA with higher absolute intensity to meet relative criteria for moderate or vigorous activity than an individual with lower CRF. This is consistent with the (coaching perspective) key concept that training “overload” (a stress that exceeds one’s current level of fitness) is required for training to improve fitness.
3. Absolute Intensity of Aerobic PA
The absolute intensity of PA is the rate of total energy expenditure. Some units of measurement of absolute intensity of total energy consumption during PA include rate of oxygen consumption (V̇O2), METs, and kilocalories.
- V̇O2, the rate of oxygen consumption (the dot over V indicates volume per unit time), can be used as a measure of PA intensity since most of the energy for endurance PA results from biochemical reactions that consume O2. V̇O2 is usually normalized to body weight as mL O2 per kilogram (kg) per minute.
- METs (“metabolic equivalents of task”) quantify typical V̇O2 for different aerobic activities relative to O2 consumption at rest (a.k.a., basal metabolic rate [BMR]). An adult quietly lying down has an energy expenditure (BMR) of approximately one MET per minute, which equals a V̇O2 of 3.5 mL O2 per kg per minute. V̇O2 values can be converted to METs by dividing V̇O2 by 3.5 (and METs can be converted to V̇O2 by multiplying by 3.5). MET-minutes and MET-hours (METs of energy use multiplied by duration in minutes or hours) are the most common units for describing the “dose” of PA in scientific studies.
- Kilocalories (kCal) – just called “calories” when used for food — can be used to quantify the same thing as METs, total energy expenditure during PA. One MET = one kCal per kg of body weight per hour. (BMR accounts for about one MET per hour for 24 hours = 24 MET-hrs per day, which can be translated into kCal as 24 times body weight, which for me is about 1,750 kCal of energy use per day. This is usually a lot more energy than I use doing endurance exercise.)
- Note: Watts are not a measure of total energy expenditure. The “productive” energy consumed in some PA activities can be measured in watts using power meters. Power meters are widely used in bicycling (both stationary biking ergometers and “real” bikes) and rowing (just stationary rowing ergometers) and have recently become available for running. These devices estimate just the energy consumed by the mechanical work of the activity, not the total energy expenditure. Most of the energy consumed during PA is turned into “waste” heat, and power meters do not measure this. (Speaking as someone who runs outside in the winter in Minnesota, “waste” heat can be a good thing and not a waste at all!)
It is a widely used convention to define: (a) vigorous-intensity PA as requiring 6.0 or greater METs, (b) moderate-intensity PA as requiring 3.0 to less than 6.0 METs, and (c) light-intensity PA (or inactivity) as requiring less than 3.0 METs.
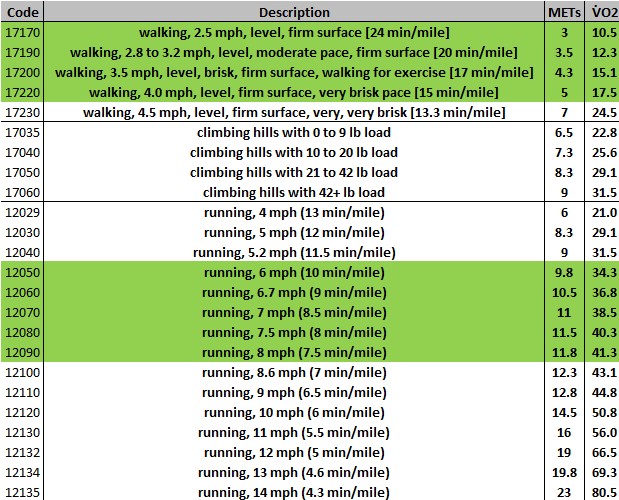
The latest version of “The Compendium of Physical Activities” provides a table that “is used globally to quantify the energy cost of PA in adults for surveillance activities, research studies, and, in clinical settings, to write PA recommendations and to assess energy expenditure in individuals.” Figure 3 shows some of MET values in The Compendium for walking, running, and climbing hills with a load (for example, “rucking” with a weighted backpack). Reference #4.
V̇O2 max is a measure of an individual’s maximal aerobic exercise capacity. V̇O2 max (or V̇O2 “peak,” a term that also includes the very common occurrence of test results that do not meet the technical criteria for “max”) can be determined directly by cardiopulmonary exercise (CPX) testing. In CPX, expired oxygen and carbon dioxide are measured while the subject walks or runs on a treadmill that progressively increases speed and/or incline (or pedals a cycle ergometer that progressively increases resistance).
Note: V̇O2 max can also be estimated by various other (less expensive) methods, but CPX is more objective and precise.
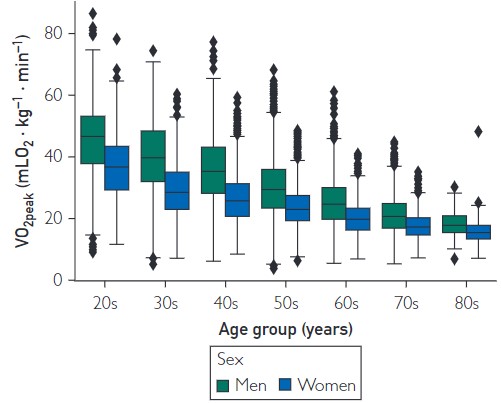
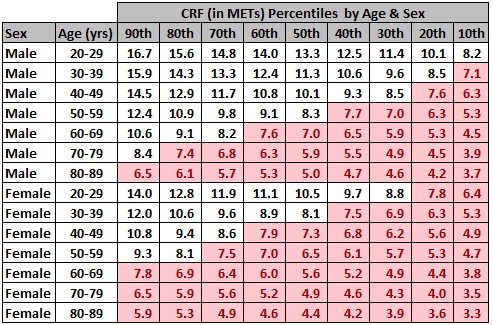
Figures 4 and 5 show reference standards by age and sex derived from 16,278 treadmill CPX tests from “apparently healthy” adults* that were performed in 34 high quality laboratories in the United States (The Fitness Registry and the Importance of Exercise National Database, FRIEND). Figure 4 is a “box plot” showing V̇O2 peak medians, interquartile ranges, and outliers by sex and age. Figure 5 shows the percentiles by sex and age of V̇O2 peak in the FRIEND population converted into METs by dividing V̇O2 peak by 3.5. Reference #5.
*Note: The authors of the published report suggest that these results are probably representative of the US population. However, I would describe FRIEND as a “convenience sample” of US adults rather than one specifically designed to be a “representative sample” of the population. I wonder if the FRIEND database may be skewed towards lower fitness values.
In Figure 5, I show sex + age group percentiles from FRIEND. I have highlighted in pink the age group percentiles that would presumably be incapable of any sustained vigorous endurance exercise using the absolute PA definition of >= 6.0 METs, if the FRIEND data is truly representative of the US population.
4. Relative Intensity of Aerobic PA
Relative intensity is an individual’s level of effort relative to their capacity for aerobic PA.
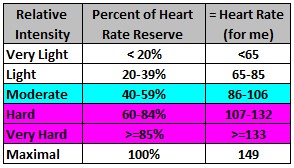
Figure 6 is based on a table in The Scientific Advisory Committee report accompanying the US PA guidelines that shows HR ranges associated with different levels of relative PA intensity, based on an individual’s resting HR, maximum HR, and calculated heart rate reserve (HRR = max HR minus resting HR). These ranges are determined by adding the listed percentage of HRR to the individual’s resting HR. Reference #6.
5. “Wearable Devices” to Measure Absolute & Relative Intensity & Duration of Aerobic PA
A nationally representative survey of US adults in 2019 estimated that 29% used “wearable devices” to measure PA (33% of the group aged 18 to 49, 24% of 50 to 64, and 14% of 65 and older; higher among individuals with higher household income). The wearable makers are working hard to increase this (e.g., Fitbit, Apple watches, Garmin, Polar, etc.). Reference #7.
I am currently using two wearable tracking devices, a Garmin watch and a Fitbit (see Figure 6). I am wearing the Fitbit because I enrolled in a long-term research study (called “All of Us [AoU]”). The AoU research study group had me complete a lot of questionnaires, give permissions to access my medical records, brought me in for biometric measurements and laboratory tests (including complete DNA sequencing), then sent and asked me to wear the Fitbit. I do not think it adds any information useful for me that my Garmin watch does not provide, and feel silly wearing two devices on my wrist, but I am trying to be a good research subject! (AoU says they cannot use Garmin data.) Reference #8.

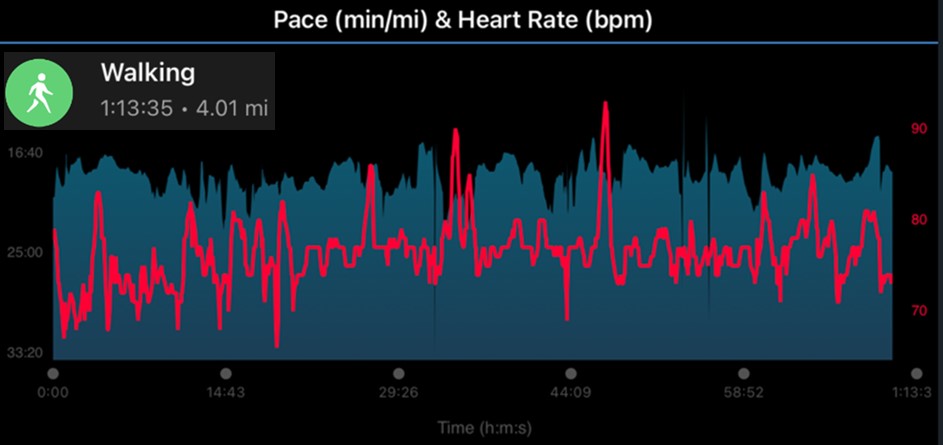
Figure 8 shows two 24-hour plots from my Garmin app, HR (upper graph) and “Activity Minutes” (lower graph). Activity minutes is Garmin’s term for minutes of moderate + two times vigorous PA, and they show a “goal” of 150 per week (as in the PA guidelines). The run clearly met both absolute and relative intensity criteria for vigorous PA. Garmin gave me credit for moderate PA for the walk, because it met absolute intensity criteria for moderate PA. However, this walk (like most walking for me and, I suspect, for many runners) did not meet relative intensity criteria for moderate PA (I noticed little change in breathing rate and had a HR below the moderate zone as shown in Figure 9).

Figure 9 is a Garmin plot of my pace (from GPS) and HR during the run shown in Figure 8. I ran 6.5 miles in 57 minutes and 56 seconds (3476 total seconds), which = average speed of about 6.7 miles per hour (mph). I ran three half-mile intervals at a faster pace, with easy pace running before, between, and after these intervals.
The Compendium lists an intensity of 10.5 METs (about 10.5 times basal metabolic rate) for running at 6.7 mph, so I consumed 3476 divided by 3600 seconds per hour times 10.5 METs = 10.14 MET-hours of metabolic energy during this run. My body weight is about 73 kg, so the metabolic cost of this run, in kcal, was 10.14 times 73 = 740 kcal, which matches what my Garmin watch reported. (My guess is that Garmin uses METs values from The Compendium to calculate kCal.) My average HR during this run was 131 beats per min. So, my watch documented that the run met both absolute (METs) and relative (HR) criteria for vigorous intensity PA.
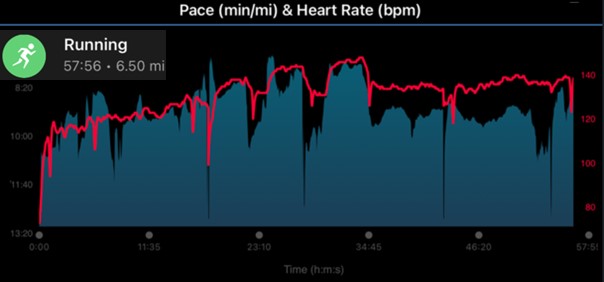
Figure 10 is a plot of my power output during this run, as measured by my Stryd foot pod. My average power for the whole run was 236 Watts, with three intervals at higher power.
One watt = one joule of energy expenditure per sec, so the power meter measured a total of 236 joules times 3476 seconds = about 831,000 joules, which = 831 kilojoules (kJ). One kJ = about 4.18 kCal, so the power meter measured about 831 divided by 4.18 = 199 kCal of mechanical energy spent during the run. 199 kCal of mechanical energy divided by 740 kCal total energy (see above) calculates to a mechanical efficiency of about 26% — roughly consistent with estimates I have read of the mechanical efficiency of running. About three fourths of the total energy consumed was turned into extra heat in my muscles rather than movement along my running route.
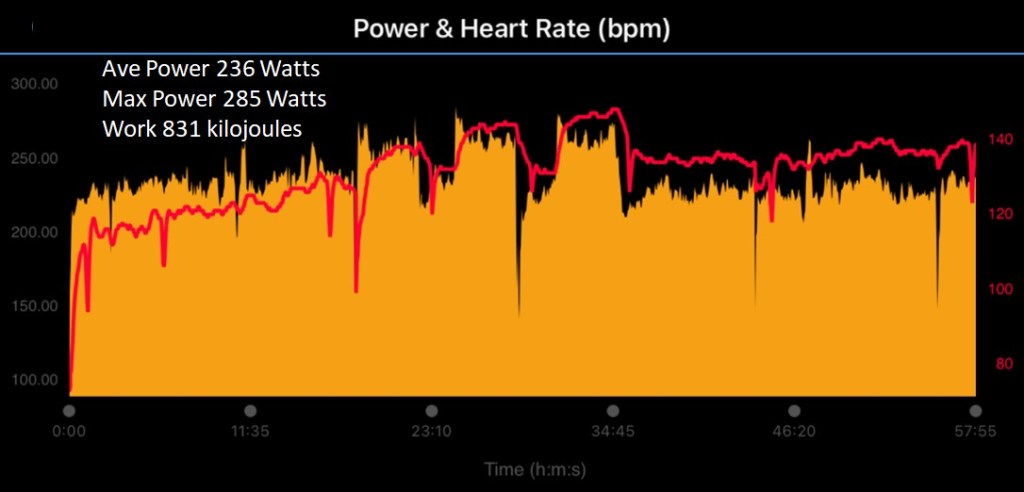
Figure 11 is Garmin’s plot of my pace (from GPS) and HR during the walk shown in Figure 8. I walked 4 miles in 73 min and 35 secs (4415 total secs), which = speed of about 3.3 mph). Per The Compendium, this was intensity of about 4.2 METs, so I consumed 4415 divided by 3600 seconds per hour times 4.2 METs = 5.2 MET-hours of metabolic energy during this walk. In kcal, this was 5.2 times my weight in kg = 376 kcal or about half the energy used by my run earlier in the day. (Thankfully, Garmin does these calculations!) My average HR was only 76. So, my watch documented that the walk met absolute (METs) but not relative (HR) criteria for moderate intensity PA.
Presumably, in a population, this discrepancy between absolute and relative intensity PA must be common in the other direction, too. Many people could accurately describe PA activity as vigorous based on relative criteria (breathing or HR) that was less than vigorous by absolute criteria (or moderate that was less than moderate by absolute criteria).
6. Amounts of PA by Age & Sex in the US Population
The National Health Interview Study (NHIS) is a cross-sectional survey funded by US taxpayers that has been conducted continuously since 1957. “The main objective of NHIS is to monitor the health of the United States population through the collection and analysis of data on a broad range of health topics. A major strength of this survey lies in the ability to categorize these health characteristics by many demographic and socioeconomic characteristics.” NHIS uses complex statistical sampling methodology that allows estimates to be made for the entire noninstitutionalized civilian population living in the US – at a manageable (but still, presumably, enormous) cost. The content of this survey has been updated periodically. In 1997, the NHIS began collecting data on moderate- and vigorous- intensity aerobic PA and muscle strengthening activity. Reference #9.
Carefully de-identified (stripped of information that could identify the individuals surveyed), cleaned, and documented annual data sets are freely available online. This makes it possible for someone (like me) with some programming skills and curiosity, to explore many different questions! (To create the figures below of amounts of PA, family income, diabetes, obesity, and depression, I used a free service from SAS Corporation that allows one to upload data to a cloud-based server then analyze it with SAS software.)
Figures 12a to 12d show results from my analysis of the average minutes per week of moderate + vigorous, just vigorous, and just moderate aerobic PA from the 2020 NHIS results, which are the most recent NHIS results with PA data. My first step was to confirm that I could exactly reproduce the results in a “statistical brief” by the National Center for Health Statistics (NCHS), which conducts NHIS. Confident that I understood how to work with the data, I was then able to go beyond the large age groupings in this official report to make PA estimates for the US adult population by sex and ten-year age groups. Reference #10.
In the survey, the interviewer reads the following script: “The next questions are about physical activities such as exercise, sports, or physically active hobbies that you may do in your LEISURE time. We are interested in two types of physical activity — moderate and vigorous-intensity. Moderate-intensity activities cause moderate increases in breathing or heart rate whereas vigorous-intensity activities cause large increases in breathing or heart rate. How often do you do MODERATE-INTENSITY LEISURE-TIME physical activities? About how long do you do these moderate leisure-time physical activities each time?” These two questions are then repeated for VIGOROUS-INTENSITY LEISURE-TIME physical activities.
- The survey does not quantify OCCUPATIONAL PA or any type of light-intensity PA.
- The survey lets the interviewee select the time period they are describing (per week, month, or year).
Figure 12a shows the estimated percent of adults by sex, ten-year age group, and number of minutes of MVPA (moderate + two times vigorous) for all civilian noninstitutionalized adults residing the US in 2020 (that is, excluding active military, prisoners, and residents of long-term care facilities). Figure 12b is a graph that, I think, simplifies these results in a way that helps with seeing the overall pattern.
- The NHIS estimate is that 48.6% of all adult males and 57.3% of all adult females do not meet the US PA guidelines recommendation of >= 150 MVPA minutes per week, though more meet this level in the younger age groups.
- However, in all age groups there are a lot of people who somewhat or greatly exceed the recommendation.
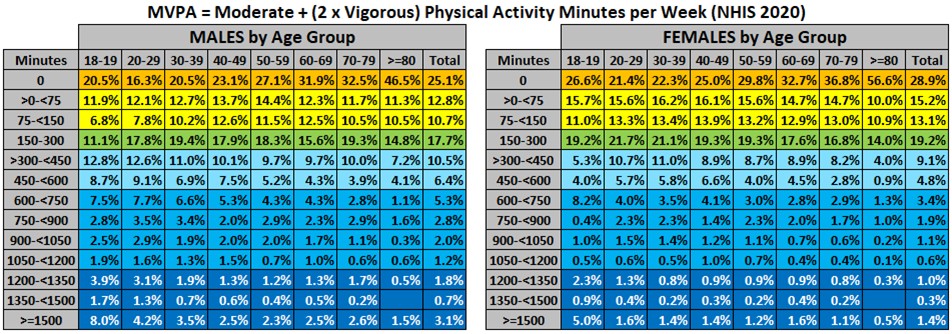
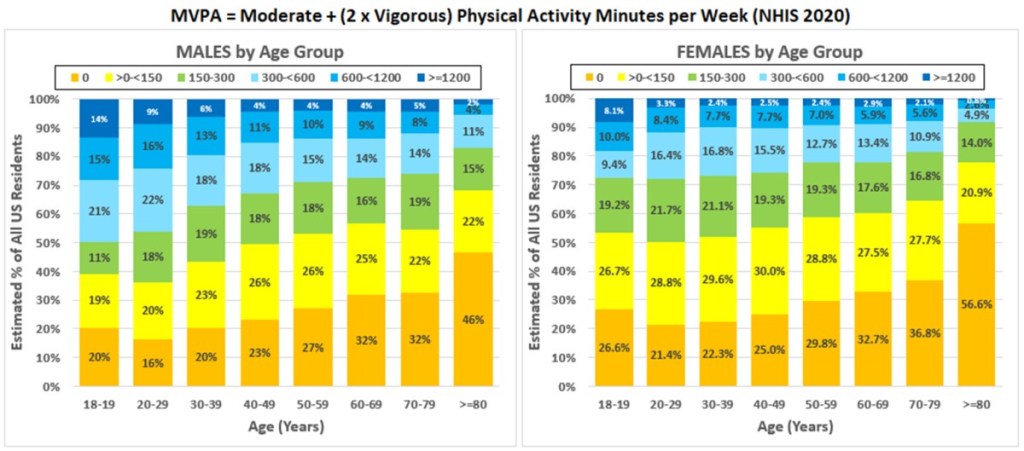
Figure 12c shows the estimated percent of adults by sex, ten-year age group, and number of minutes vigorous PA for all civilian noninstitutionalized adults residing the US in 2020.
- 57.6% of all adult males and 68.6% of all adult females reported zero minutes of vigorous PA.
- However, in all age groups there are people who said they do a lot of vigorous PA. The people with >=600 minutes (ten hours) of vigorous PA probably includes many runners but I would guess that biking enthusiasts may make up a disproportionate fraction.

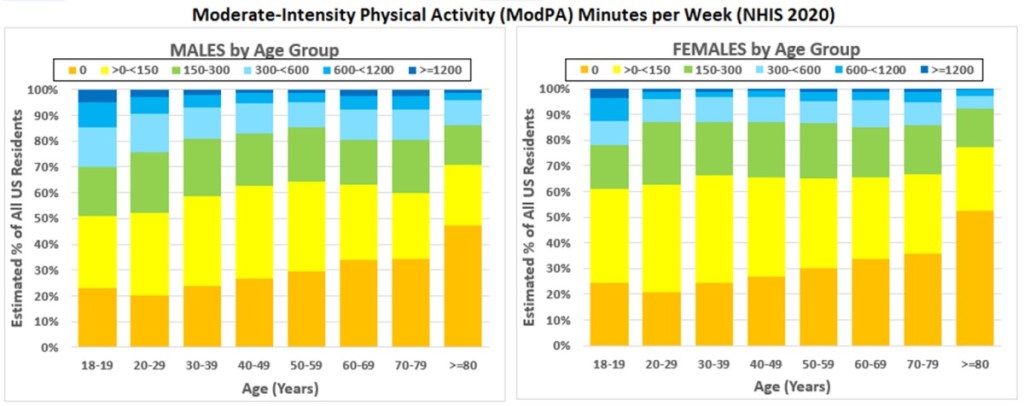
Just for completeness, Figures 12d shows the estimated percent of adults by sex, ten-year age groups and number of minutes moderate PA for all civilian noninstitutionalized adults living in the US in 2020.
7. Introduction to Studies Attempting to Quantify the Dose-Response Effects of PA on Health Outcomes
(7a) The Usual Way PA Dose – Health Response Studies have been Designed
I made a first pass (in my preceding post) at identifying observational studies that provide some of the best evidence that a higher amount long-term PA decreases the risk of dementia. There are many more observational studies that have found a dose-response association between long-term PA and all-cause mortality and its two top causes, cardiovascular disease and cancer. A much smaller number of observational studies have attempted to show a dose-response effect of long-term PA on incidence of diabetes and depression, also enormously important health outcomes. Public health PA guidelines use the results from these observational studies to support their recommendations about weekly dose of PA.
There are no studies that use the best study design — the randomized controlled clinical trial — for determining whether there is a causal relationship between long-term PA and health outcome, and I doubt there could be. The evidence presented is that there is a statistical association between some measurement of individuals’ PA and their health outcomes years later.
Believe it or not, there are HUNDREDS of published studies (new ones appear often!) with the same basic design:
(a) a large group of study subjects (a “prospective cohort”) was created,
(b) the typical amounts of “non-occupational” moderate- and vigorous-intensity PA were measured for each subject at the start of the study,
(c) other variables (such as age, sex, education, chronic medical conditions, smoking history, diet, etc.) that might also affect the health outcomes of interest were also determined for each subject at the start of the study,
(d) the study subjects were then followed for a long time (in some studies, for decades) to identify which ones experienced the health outcomes (most often death has been the outcome studied) and when, then
(e) researchers estimated how strongly the PA “dose” was associated with the studied health outcome relative to being inactive, after statistically adjusting for the other variables.
(7b) Statistical Association May Be Due to “Reverse Causality” or “Confounding” or Measurement Error
One needs to retain skepticism about how much of this association may be due to a causal relationship (more PA causes better health outcomes) and how much may be explained by (1) potential reverse causality, (2) potential confounding by other factors, and/or (3) measurement error (long-term PA is very hard to quantify).
Reverse causality here refers to the direction of influence between PA and health. For example, some of the statistical association studies between dementia and lower amounts of PA (see my previous post) may have been because some study subjects who were identified as new cases of dementia during follow-up already had early dementia (or mild cognitive impairment) at the start of the subject and dementia/MCI might have caused lower amounts of PA, rather than the reverse.
Confounding refers to additional variables that are associated both with PA and the measured outcomes. For example, one important confounding variable that was not included in many published studies is family income.
- There are lots of reasons why higher family income may favor more PA, such as lower “barriers” (more time, safer and/or more enjoyable places and ways to engage in PA).
- There are also lots of reasons – in addition to more PA — why family income may favor better health outcomes (better nutrition, living conditions, education, access to medical care, lower stress, etc.).
Figure 13 shows the distribution of family income for adults in the US civilian noninstitutionalized population, as estimated by NHIS 2020, using categories of the ratio of family income to the 2020 Federal Poverty Threshold (FPT). FPT varies based on the number of adults and children in the family. The 2020 FPT was $17,331 for a family consisting of just two adults under 65 years of age (five times FPT was $86,655).
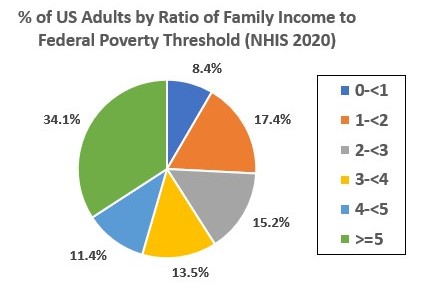
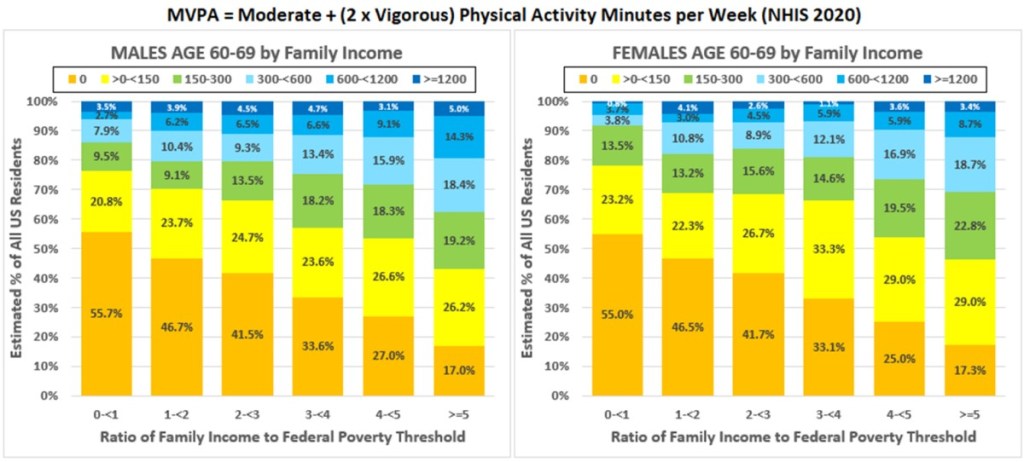
Figure 14 shows the estimated percentages with different levels of MVPA for all US adults aged 60-69, stratified by family income categories. There is a very strong association with family income.
Long-term PA measurement errors. Most published studies have measured PA by having each subject estimate their amount of PA as minutes or hours categorized either (1) by (subjective) moderate or vigorous relative intensity (as in NHIS) or (2) by specific types of activity (e.g., walking, jogging or running, cycling, swimming, racquet sports, aerobics classes, exercise machines, golf) and then converted by the researchers into MET-hours per week using the absolute intensity values in The Compendium of Physical Activity (sum of compendium METs multiplied by number of hours of each specific type of activity). Only a small number of studies (to date) have used wearable devices to measure intensity and duration of PA.
In most studies, PA amount was only determined at the start of the study. I think it is probably very common for PA to vary a lot over the course of follow-up stretching many years. As examples, people change their exercise habits by choice or due to life changes that make exercise easier or harder to fit in. This type of measurement error can weaken the statistical association because some subjects are misclassified as having higher long-term PA than they did, and some are misclassified as having lower (many published papers call this problem “regression dilution” in their discussion of study limitations.)
8. Dose-Response Association Between PA & All-Cause Mortality, Cardiovascular Disease, and Cancer
I would like to briefly describe results from three published papers:
- The first, Garcia 2023, is a meta-analysis of PA dose-response that includes results from all studies published prior to February 2019 that met the researchers’ criteria. Reference #11.
- The second, Arem 2015, was included in the Garcia meta-analysis, but stands out because it was an exceptionally large study with long follow-up, which gave it sufficient statistical power to demonstrate that there were (at least small) additional benefits from levels of PA higher than the guidelines’ recommendations. Reference #12.
- The third, Lee 2022, is another very large study. This study asked subjects about their amounts of PA during every two years of follow-up (median follow-up was 26 years). They averaged the many measures of PA for each subject, which probably provides a much better estimate than any other study I have read of the level of PA over the course of follow-up. This study also found additional benefits from levels of PA higher than the guidelines’ recommendations. Reference #13.
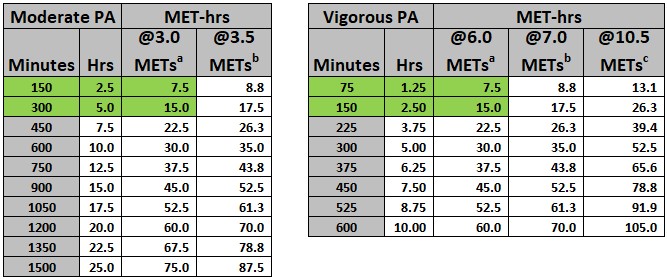
To help interpret their results, in Figure 15 I have translated minutes of PA into MET-hrs using the standard assumptions that moderate-intensity is about 3.0 METs and vigorous-intensity is about 6.0 METs and the assumptions used by Garcia 2023 and two other papers mentioned below (3.5 and 7 METS, respectively). I also added a column with MET-hrs calculated for 10.5 METs, since a large fraction of my running is currently at about that intensity. Very many runners, of course, routinely run much faster. (I follow a local professional distance runner on Strava, so I know her easy training runs tend to be at almost 14.5 METs, based on The Compendium!)
(8a) Garcia 2023: A Meta-analysis 196 Studies of PA & All-Cause Mortality, Cardiovascular Disease, and Cancer
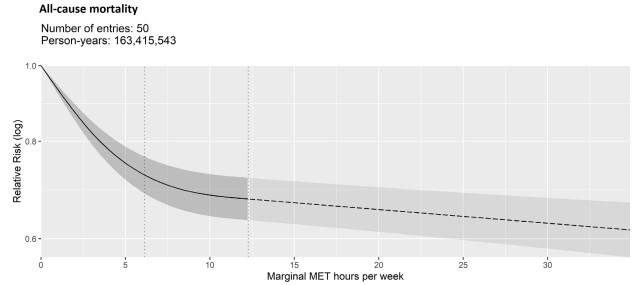
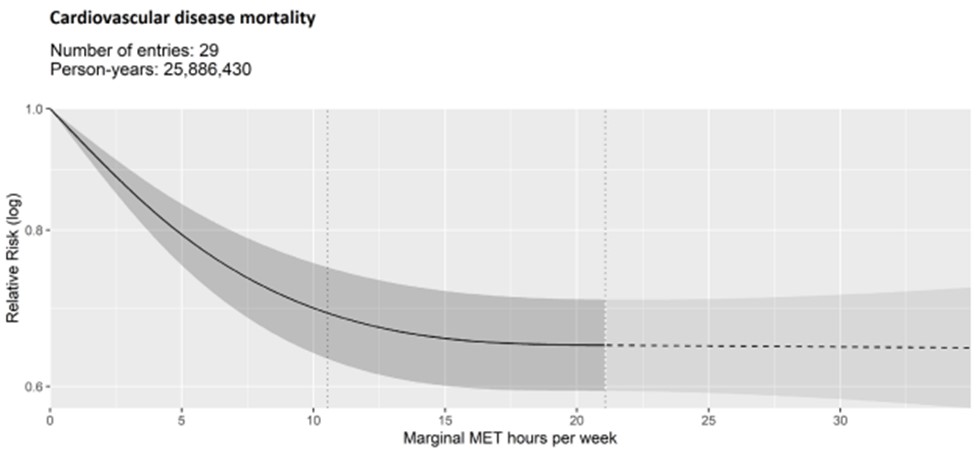
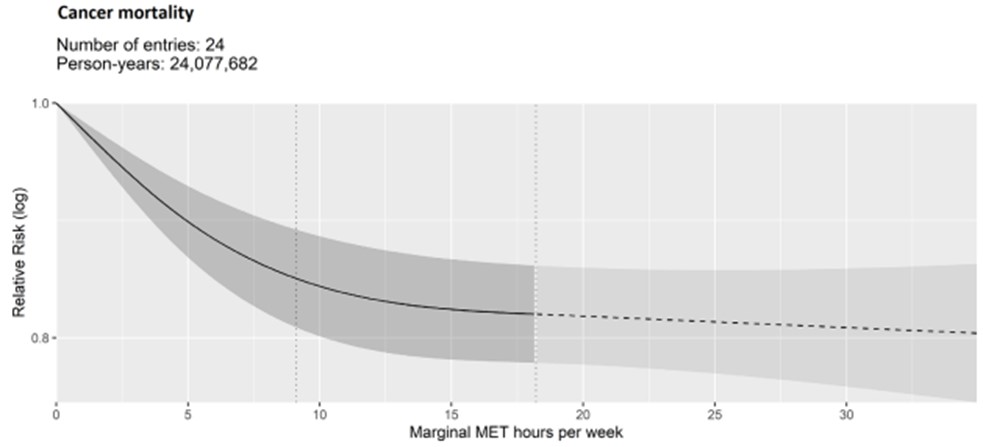
The Garcia paper presents meta-analysis of results from 196 different published studies! Pooled together, these studies have prodigious numbers of person-years of follow-up for all-cause, cardiovascular, and cancer mortality, as well as incidence (new diagnosis of) coronary heart disease, stroke, and cancer by 14 different sites. Figures 16a to 16c are representative examples of the dose-response estimated from this (open access) journal article.
- 76% of all subjects had PA amounts below 17.5 MET-hours/week (that is, at or below 300 minutes of MVPA).
- 94% of all subjects had PA amounts below 35 MET-hours/week, which is the maximum PA amount shown in any of the paper’s dose-response graphs.
- Consistent with PA guidelines, the dose-response relationships are all curvilinear, with a rapid initial decrease in risk as PA increases, then a leveling out. The shaded areas above and below the curvilinear plot are the 95% confidence limits.
(8b) Arem 2015: A Very Large Study of PA and All-Cause Mortality
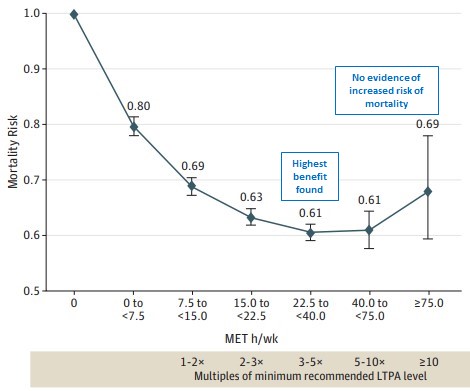
Arem 2015 is a study that pooled data from six National Cancer Institute studies with self-reported PA amounts for a total of 661,137 adults with a median follow-up time of 14.2 years (using median as estimate of average follow-up, this calculates to 9.4 million person-years). In addition to having a large total number of “person-years,” about 40% indicated typical PA amounts in excess of guidelines recommendation – similar to NHIS adults with family income in the upper third of the population (see above).
The results of this study were among those combined for the Garcia meta-analysis (see above), which only reported risk associated with MVPA up to 17.5 MET-hrs/wk (in the article’s table of results). However, the Arem’s study’s objective was, “To quantify the dose-response association between leisure time physical activity and mortality and define the upper limit of benefit or harm…”
Figure 17 is a slightly modified version of the key figure in this paper. They found “an upper threshold for mortality benefit” at 22.5 to 40 MET-hrs/wk (three to five times PA guidelines’ recommendation). Above this level, confidence limits were wide due to the relatively small number of subjects with higher PA levels. The authors did conclude, “There was no evidence of harm at 10 or more times the recommended [amount].”
(8c) Lee 2022: A Study with Better (the Best so Far?) Measurement of Long-term PA
Lee 2022 is another large study with long follow-up of subjects. Of the studies I have read, I think this one provides the best measurements of the amount of PA.
This study combined data from the Nurses’ Health Study, a prospective study that enrolled female nurses, and the Health Professionals Follow-up Study, a prospective study that enrolled male health professionals. The paper reports on outcomes observed during up to 30 years of follow-up for 116,221 adults (about three million person-years – so about one third the size of the Arem study).
In almost all other epidemiologic studies, long-term PA was measured at a single time at the start of the study. This one value is then assumed to be a meaningful assessment of their PA preceding throughout (often very long) follow-up. Subjects who increased or decreased their PA amounts during the study were therefore misclassified with respect to level of PA, which would tend to blunt any statistical association between PA amount and outcomes (“regression dilution”).
Study subjects in Lee 2022 provided detailed information about their PA in questionnaires they completed at enrollment and every two years. The measured PA for each study subject was the average from up to 15 different questionnaires!
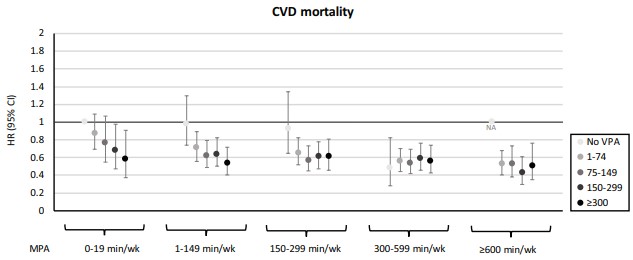
The authors concluded, “Our study supports the current physical activity guidelines and further suggests that performing a high level of long-term leisure-time MPA [moderate PA] beyond 4 times the minimum recommended physical activity guideline (≈600 min/wk of MPA [moderate PA]) was consistently inversely associated with all-cause, CVD, and non-CVD mortality…The nearly maximal benefit on mortality reduction of VPA [vigorous PA] was observed at ≈150 to 300 min/wk, twice the currently recommended VPA range of 75 to 150 min/wk. There was no greater risk of mortality even at very high levels of VPA, although no additionally lower mortality was observed beyond 300 min/wk of VPA.”
One interesting type of analysis they report is “joint analysis” of different amounts of MPA combined with different amounts of VPA. For example, they interpret their results for cardiovascular disease mortality (Figure 18) as showing that outcomes for individuals with >= 600 min/wk of moderate-intensity PA were not improved by any amount of additional vigorous-intensity PA. (The way I read this graph is that for someone, like me, averaging >= 300 min/week of vigorous PA, there may be no long-term CVD mortality reduction from adding any amount of moderate-intensity PA – though, of course, there could be other benefits!)
(8d) How Does PA Lower the Risk of All-Cause Mortality, Cardiovascular Disease, and Cancer?
Here are two interesting figures from two articles (sort of) discussing mechanisms by which PA causes these benefits.
Figure 19 is based on a figure in a clinical practice statement from the American Society of Preventive Cardiology. Reference #14.
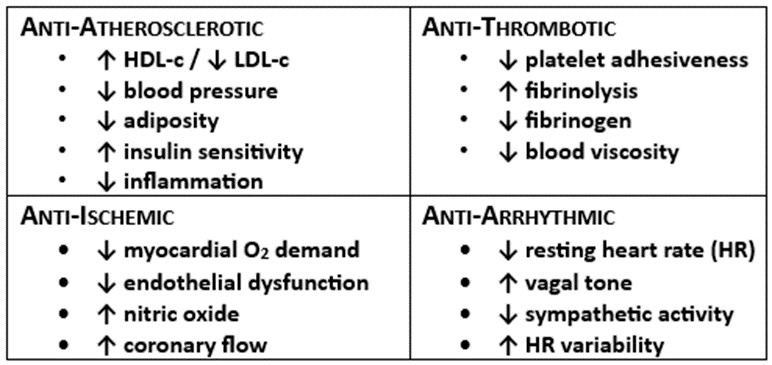
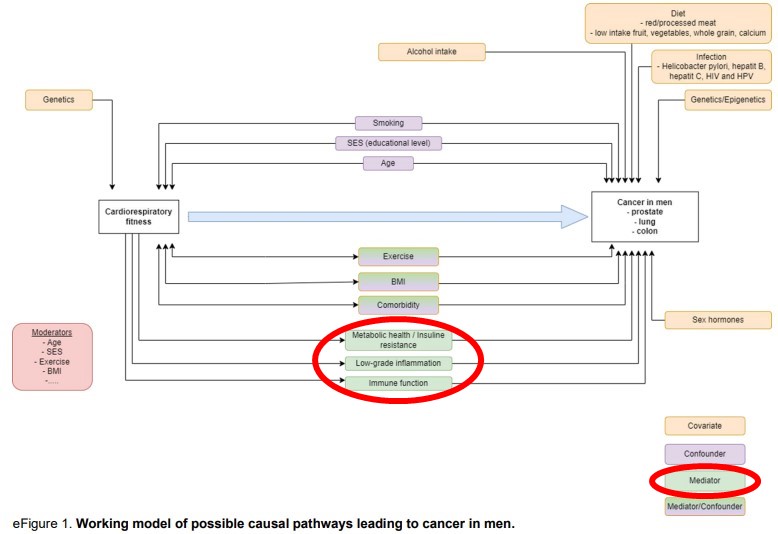
Figure 20 is from a research report on the association between cardiorespiratory fitness (rather than PA) and the incidence of and mortality from prostate, colorectal, and lung cancer in men. Reference #15.
These authors had long follow-up data on outcomes in a group of Swedish men who had cardiorespiratory exercise testing on enrollment in an employer-sponsored health promotion program. I think this diagram beautifully illustrates hypotheses about how various measurable factors influence the risk of developing these common cancers. They identify three categories of factors as likely mechanisms by which better CRF (and presumably more PA) reduces the risk of cancer:
- Metabolic health/ insulin resistance,
- Low-grade inflammation, and
- Immune function.
The field of PA and the immune system is quite complex, but there is a biologically plausible hypothesis that exercise improves immunosurveillance against cancer cells (and pathogens, too – several studies came out during the COVID-19 pandemic that showed better outcomes among people with higher physical fitness). Reference #16.
9. Dose-Response Association Between PA & Type 2 Diabetes
(9a) Importance, Prevalence, and Incidence of Diabetes
Diabetes mellitus is a profoundly important underlying cause or contributing factor for many of the leading causes of premature death and/or disability. However, the most common type of diabetes (type 2) most often causes no (or only subtle) symptoms and is only detected by laboratory testing or the presence of characteristic “complications of diabetes” that usually only develop after years of diabetes.
Diabetes is a major risk factor for cardiovascular disease (coronary artery disease, heart failure, stroke, peripheral artery disease) and dementia. It is also the top cause of chronic kidney disease that results in end stage kidney disease (that may require long-term dialysis or kidney transplantation), amputations of the foot or legs (due to peripheral artery disease and diabetic neuropathy resulting in traumatic injuries and poorly healing ulcers), and new onset of blindness (diabetic retinopathy).
Figure 21 shows the estimated prevalence of US adults by sex and ten-year age groups who answered “Yes” to the NHIS 2020 question, “Has a doctor or other health professional ever told you that you had diabetes [excluding gestational diabetes during pregnancy]?” Better estimates of prevalence are provided by the National Health and Nutrition Examination Survey (NHANES), which brings a representative sample of US residents in for extensive laboratory testing. Recent NHANES results found that about 3% of adults had undiagnosed diabetes. NHANES found that another 34% of all adults met criteria for pre-diabetes (and over half of them did not know). Reference #17.

Although Figure 21 shows the cross-sectional (that is, at one point in time) prevalence of diagnosed diabetes, the change in prevalence from one age group to the next age group provides an approximation of the cumulative incidence (number of newly diagnosed) by age group. For ages 40-49 to 70-79, this appears to be a little over 5% for each ten years of aging (about 0.5% per year). (Prevalence at a point in time = number of new diagnoses minus the number who have gone into remission. Some cases of type 2 diabetes do go into remission – following intensive lifestyle changes or gastric bypass surgery, as examples – but, sadly, currently most who are diagnosed continue to meet criteria for the remainder of their lives.)
(9b) Smith 2016: A Meta-analysis of 28 Studies PA & Incidence of Type 2 Diabetes
Smith 2016 is the best study I have found of the dose-response effect of PA on the risk of developing type 2 diabetes. This was a meta-analysis that pooled the results from 28 observational studies, which together had 1.3 million subjects of whom 84,134 developed diabetes during follow-up ranging from three to 23 years. Reference #178.
Figure 22 shows their statistical model of the dose response relationship. Their results suggest that individuals who accumulate PA equivalent to the guidelines’ recommendation of 150 minutes/week of MVPA have a relative risk (RR) of developing diabetes of 0.74 (26% lower, 95% confidence limits 20% to 31%) compared to sedentary individuals. Double the guidelines’ recommended amount of PA was associated with a RR of 0.64 (36% lower, C 27% to 46%). And still higher doses of PA further reduced the RR of diabetes.

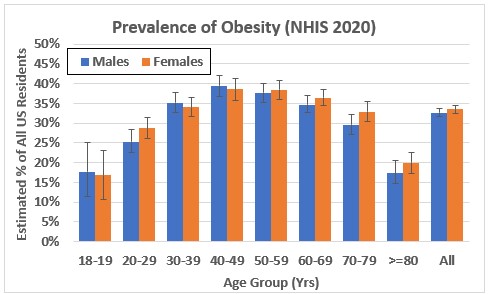
An important question about the association of PA and diabetes relates to how much is due to obesity, which has a well-established causal relationship with diabetes. The amount of PA has a statistical association with obesity, which is very common in the US adult population (see Figure 23) and probably partly explains some of the benefits of PA on risk of diabetes. The Smith 2016 paper also reports results that adjusted for body mass index (BMI). They state, “Adjustment for BMI appeared to attenuate the pooled protective effect size by around one-third.” (In other words, about two-thirds of the risk-lowering associated with more PA was not explained by lower BMI.)
The authors state in the introduction that there are randomized clinical trials of the effect of PA on high-risk populations, such as individuals with pre-diabetes. They note, “However, the majority of these studies include both diet and PA interventions, and isolation of the impact of PA itself is rarely possible. It is also difficult to evaluate the benefits of the whole PA exposure continuum from trials, as most intervention studies focus on shifting participants’ behaviours towards the recommended levels of exercise rather than assessing the benefits of changes at the lowest ends of the normal PA spectrum, or the additional benefits gain at the highest level. Therefore, although associated with a higher risk of confounding, evidence from cohort studies [observational studies rather than randomized clinical trials] in the general population can provide complementary evidence of the dose-response relationship between PA and diabetes, independent of diet.”
10. Dose-Response Association Between PA & Depression
(10A) Importance and Prevalence of Major Depressive Disorder
Major Depressive Disorder (MDD) is among the most important causes of disability in the US adult population. In addition, MDD is recognized as a leading risk factor for dementia, coronary heart disease, chronic pain, and suicide.
MDD is briefly defined as having persistent feelings of sadness and lack of interest or pleasure in doing things, accompanied by bodily and cognitive changes, lasting at least two weeks and significantly affecting the individual’s ability to function. (A full set of diagnostic criteria is specified in the American Psychiatric Association’s Diagnostic and Statistical Manual of Mental Disorders [DSM-5].)
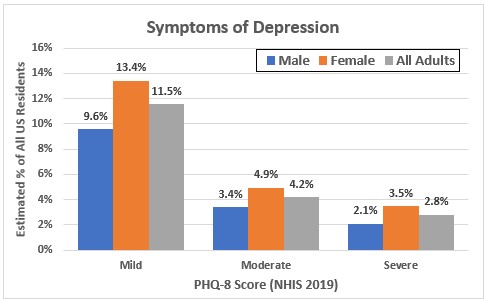
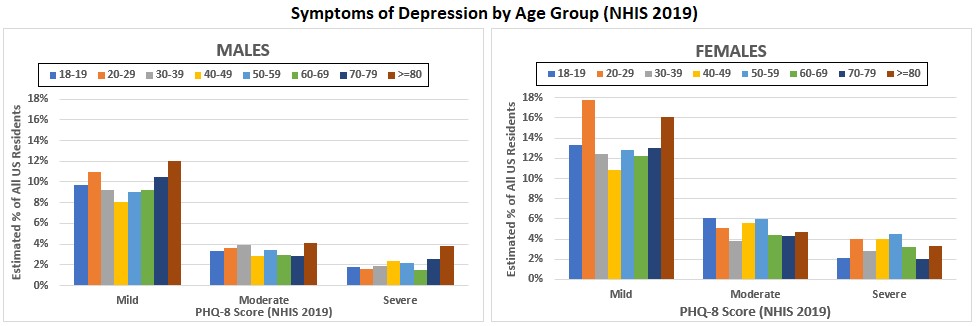
The 2019 NHIS included the eight question Patient Health Questionnaire (PHQ-8) for depressive symptoms, which is commonly used to screen for depression.
Figure 24a shows the estimated percentages of US adults with PHQ-8 scores indicating mild, moderate, or severe symptoms of depression for all adults by sex. Figure 24b shows the estimated percentage by sex and ten-year age groups. (I created these by downloading and analyzing NHIS 2019, the most recent NHIS with the PHQ-8 questions. Alas, no NHIS year has included both these questions and the PA questions.)
The caption for Figure 24b describes the eight questions and scoring. PHQ-8 scores indicating moderate or severe symptoms have been shown to have high sensitivity and specificity for a diagnosis of MDD, compared with diagnosis using a semi-structured clinical interview based on DSM criteria.
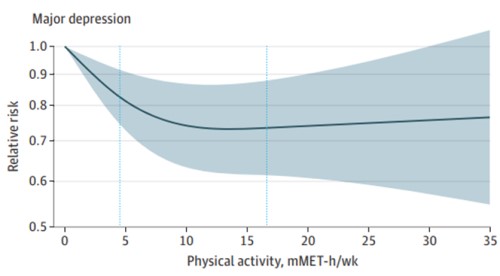
(10B) Pearce 2022: A Meta-analysis of 15 Studies of Dose-Response Between Amount of PA & Risk of Depression
Pearce 2022 is a meta-analysis by the same group of authors as the Garcia 2023 study described above. Reference #19.
In this study, they pooled results from 15 prospective studies (2.1 million person-years) that reported amount of MVPA at three or more levels and estimated risk of depression for each. They found a curvilinear dose-response relationship (see Figure 25), with a rapid initial decrease in risk as PA increases, then a leveling out. Due to the wide confidence limits for the estimates, the authors were not able to determine whether there was a further decrease beyond the upper end of the guidelines’ recommended dose of 300 min/week of MVPA — which, in this paper, corresponds to 17.5 MET-hrs/week.
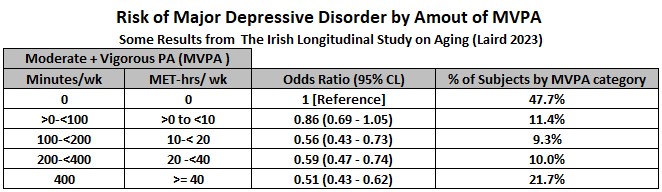
(10C) Laird 2023: Dose-Response Between PA & Depression from “The Irish Longitudinal Study on Aging”
The Irish Longitudinal Study on Aging (TILDA) has followed a representative sample of adults in Ireland who were aged >= 50 years at study start in 2009. Every two years for ten years, all study subjects completed questionnaires about their amount of MVPA and their depressive symptoms (this study used the eight-item CES-D, which is similar to the PHQ-8) and at two-year intervals they had nurse health assessments with a structured interview that determined probability of a major depressive episode during the preceding 12 months.
Laird 2023 is a report that analyzed the statistical association between MVPA and MDD during five two-year time intervals for the 4,016 TILD subjects who remained enrolled and had complete data for all ten years. As with the Lee 2022 study described above, having multiple assessments of PA throughout the study probably increases the accuracy of PA measurement. Reference #20.
Figure 26 shows selected results from Tables 1 and 2 of this paper. The odds ratios for MDD (vs no MDD) at five levels of PA are similar to the risk ratios found by Pearce 2002 in showing a decreased risk of MDD with small increases in PA but also show further reduction in risk with still higher amounts of PA.
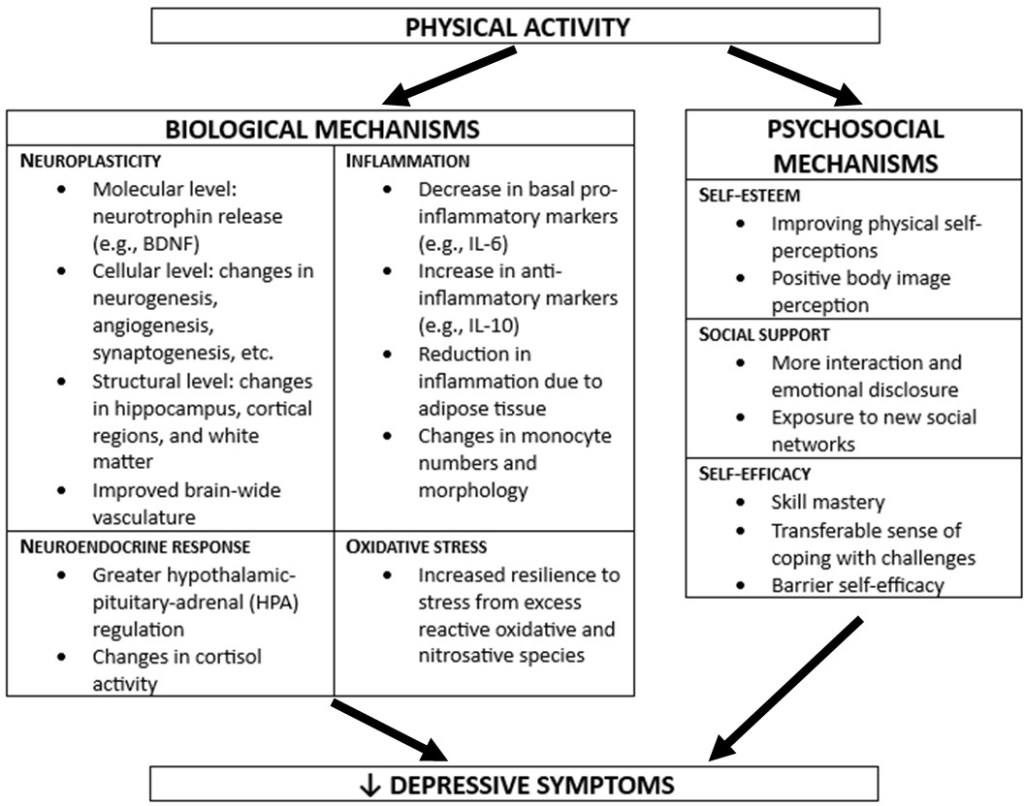
(10D) Antidepressant Mechanisms of PA
Figure 27 is based on a figure from a review entitled, “Physical activity and depression: Towards understanding the antidepressant mechanisms of physical activity.” Reference #21.
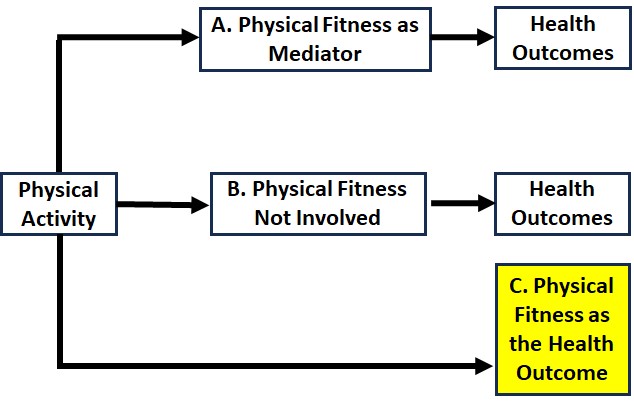
11. My Thoughts on the Question, “Have I Maxed Out the Benefits of Aerobic PA?” (No. Physical Fitness Itself as a Positive Health Outcome Associated with PA & Much Opportunity Remains for Me.)
I began my exploration of epidemiologic evidence that PA was causally related with health outcomes with the assumption – and still suspect — that this is primarily because engaging in PA can increase physical fitness and increased fitness is the “mediator” (what causes) the beneficial effects, such as lowered risk of heart disease. However, as outlined in Figure 28, PA may also cause some positive health outcomes by mechanisms that do not involve increasing fitness (i.e., just moving may be enough). And, perhaps more notably, physical fitness itself is an enormously valuable health outcome – the ability to “do” things and to feel good.
With health outcomes like apparent absence of dementia or cardiovascular disease, of course, I cannot tell whether or not endurance exercise is making a difference. I have to rely on scientific evidence such as the large cohort studies mentioned above to support the belief that my efforts may help a bit. It also seems clear to me that there so many (most) of the important factors (e.g., the genes I was dealt and other types of luck) are outside of my control.
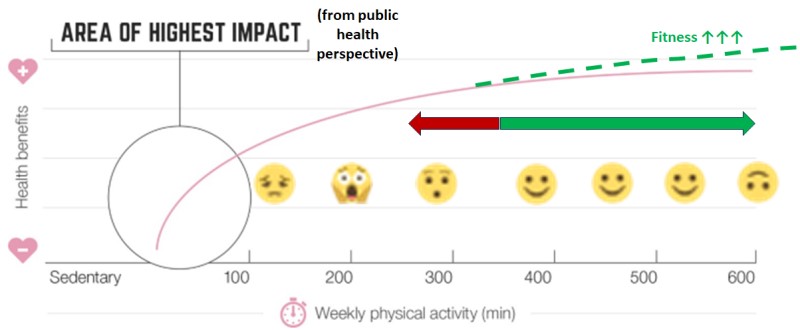
In contrast, fitness is a health outcome that I can monitor. I know from lots of personal experience that (endurance exercise) fitness shows very noticeable improvements over rather short periods of time when I am running well and regularly and declines disturbingly fast when my training is decreased or stopped (such as following injury). And I am sure that fitness usually continues to improve as one moves through levels of PA that greatly exceed PA guidelines recommendations.
Figure 29 is a figure from the UK PA guidelines that I modified by adding the:
- dotted green line to indicate that endurance fitness probably does not plateau within this range of PA,
- red/green arrow to depict how I view having an average amount of vigorous PA in this range (worried about changes in the red direction, pleased by changes in the green direction), and
- emojis to depict my feelings about being on different parts of the horizontal axis (e.g., terrified by sliding downhill to the left both because of the increased health risks and the difficulty climbing back up to where I want to be).
My answer to the question, “Do I run too much or try to run too much?” is that I do not think so, as long as I still assess that the many benefits from running exceed the risks and the “opportunity costs” of other ways I could be spending time and other resources that I cannot because of my running obsession.
I should add, though, that I will continue to assess this question as I learn more, or important variables change (such as my age and known health conditions).
References
All the references I cite were obtained for free online. If you are interested in any of the ones without a hyperlink provided, I recommend entering the title of the article in a search engine like Google then looking through the results for those that require no payment.
- Piercy, K. L., Troiano, R. P., Ballard, R. M., Carlson, S. A., Fulton, J. E., Galuska, D. A., George, S. M., & Olson, R. D. (2018). The physical activity guidelines for Americans. JAMA – Journal of the American Medical Association, 320(19), 2020–2028.
- UK Chief Medical Officers’ Physical Activity Guidelines (2019).
- World Health Organization guidelines on physical activity and sedentary behaviour (2020).
- Ainsworth, B. E., Haskell, W. L., Herrmann, S. D., Meckes, N., Bassett, D. R., Tudor-Locke, C., Greer, J. L., Vezina, J., Whitt-Glover, M. C., & Leon, A. S. (2011). 2011 compendium of physical activities: A second update of codes and MET values. In Medicine and Science in Sports and Exercise (Vol. 43, Issue 8, pp. 1575–1581).
- Kaminsky, L. A., Arena, R., Myers, J., Peterman, J. E., Bonikowske, A. R., Harber, M. P., Medina Inojosa, J. R., Lavie, C. J., & Squires, R. W. (2022). Updated Reference Standards for Cardiorespiratory Fitness Measured with Cardiopulmonary Exercise Testing: Data from the Fitness Registry and the Importance of Exercise National Database (FRIEND). Mayo Clinic Proceedings, 97(2), 285–293.
- U.S. Dept of Health and Human Services. 2018 Physical Activity Guidelines Advisory Committee Scientific Report.
- Dhingra, L. S., Aminorroaya, A., Oikonomou, E. K., Nargesi, A. A., Wilson, F. P., Krumholz, H. M., & Khera, R. (2023). Use of Wearable Devices in Individuals with or at Risk for Cardiovascular Disease in the US, 2019 to 2020. JAMA Network Open, 6(6).
- National Institute of Health. All of US Research Program. https://allofus.nih.gov/.
- National Health Interview Survey. https://www.cdc.gov/nchs/nhis/index.htm.
- Elgaddal N, Kramarow EA, Reuben C. Physical activity among adults aged 18 and over: United States, 2020. NCHS Data Brief, no 443. Hyattsville, MD: National Center for Health Statistics. 2022.
- Garcia, L., Pearce, M., Abbas, A., Mok, A., Strain, T., Ali, S., Crippa, A., Dempsey, P. C., Golubic, R., Kelly, P., Laird, Y., McNamara, E., Moore, S., de Sa, T. H., Smith, A. D., Wijndaele, K., Woodcock, J., & Brage, S. (2023). Non-occupational physical activity and risk of cardiovascular disease, cancer and mortality outcomes: a dose–response meta-analysis of large prospective studies. British Journal of Sports Medicine, bjsports-2022-105669.
- Arem, H., Moore, S. C., Patel, A., Hartge, P., Berrington De Gonzalez, A., Visvanathan, K., Campbell, P. T., Freedman, M., Weiderpass, E., Adami, H. O., Linet, M. S., Lee, I. M., & Matthews, C. E. (2015). Leisure time physical activity and mortality: A detailed pooled analysis of the dose-response relationship. JAMA Internal Medicine, 175(6), 959–967.
- Lee, D. H., Rezende, L. F. M., Joh, H. K., Keum, N., Ferrari, G., Rey-Lopez, J. P., Rimm, E. B., Tabung, F. K., & Giovannucci, E. L. (2022). Long-Term Leisure-Time Physical Activity Intensity and All-Cause and Cause-Specific Mortality: A Prospective Cohort of US Adults. Circulation, 146(7), 523–534.
- Franklin, B. A., Eijsvogels, T. M. H., Pandey, A., Quindry, J., & Toth, P. P. (2022b). Physical activity, cardiorespiratory fitness, and cardiovascular health: A clinical practice statement of the ASPC Part I: Bioenergetics, contemporary physical activity recommendations, benefits, risks, extreme exercise regimens, potential maladaptations. In American Journal of Preventive Cardiology (Vol. 12).
- Ekblom-Bak E, Bojsen-Møller E, Wallin P, Paulsson S, Lindwall M, Rundqvist H, Bolam KA. Association Between Cardiorespiratory Fitness and Cancer Incidence and Cancer-Specific Mortality of Colon, Lung, and Prostate Cancer Among Swedish Men. JAMA Netw Open. 2023 Jun 1;6(6):e2321102.
- Fiuza-Luces C, Valenzuela PL, Gálvez BG, Ramírez M, López-Soto A, Simpson RJ, Lucia A. The effect of physical exercise on anticancer immunity. Nat Rev Immunol. 2023 Oct 4.
- CDC. National Diabetes Statistics Report (2020): Estimates of diabetes and its burdens in the Unted States.
- Smith AD, Crippa A, Woodcock J, Brage S. Physical activity and incident type 2 diabetes mellitus: a systematic review and dose-response meta-analysis of prospective cohort studies. Diabetologia. 2016 Dec;59(12):2527-2545.
- Pearce M, Garcia L, Abbas A, Strain T, Schuch FB, Golubic R, Kelly P, Khan S, Utukuri M, Laird Y, Mok A, Smith A, Tainio M, Brage S, Woodcock J. Association Between Physical Activity and Risk of Depression: A Systematic Review and Meta-analysis. JAMA Psychiatry. 2022 Jun 1;79(6):550-559.
- Laird, E., Rasmussen, C. L., Kenny, R. A., & Herring, M. P. (2023). Physical Activity Dose and Depression in a Cohort of Older Adults in The Irish Longitudinal Study on Ageing. JAMA Network Open, 6(7), e2322489.
- Kandola A, Ashdown-Franks G, Hendrikse J, Sabiston CM, Stubbs B. Physical activity and depression: Towards understanding the antidepressant mechanisms of physical activity. Neurosci Biobehav Rev. 2019 Dec;107:525-539.

Leave a comment