An important part of what has attracted so many runners to Grandma’s Marathon from far away probably is the hope that it will have reasonably cool temperatures even though it takes place only a couple of days before the summer solstice. Another important factor is probably that that course is relatively flat – total elevation gain (sum of the “ups”) is only about 700 feet (with no big hills) and there is a net loss of about 130 feet from start to finish (the sum of the “downs” is about 830 feet).
Flatness is guaranteed but, alas, Grandma’s does not always have perfect running weather! Ask a group of people who are veterans of the race and several will probably be eager to re-tell their favorite weather story likely to include one to several of the following elements: a) a miserable drive up Interstate 35 on a sweltering (over 90 degrees) Friday evening (plus or minus embellishments like a non-functioning car air conditioner and/or unhappy accompanying children and/or spouse), b) a gloriously cool air mass and lots of clouds (in the stories I have heard this is often recalled as arriving miraculously overnight like an answer to prayers), c) a headwind or a tailwind or no wind, d) drenching rainfall, e) cloudless sky with baking sun, f) high temperatures, or g) humidity way too high for human sweating to work well as a cooling mechanism. Of these, I would define b as “dream conditions” (sometimes the strong tailwind version of c is also part of the “dream” package). Combinations of e, f, or g (+/- no wind) can pose a major thermoregulatory challenge.
Down in Minneapolis we have been suffering through the first heat wave of the year during the past week (and expected to continue next week) with temperatures in the upper 90 degrees range every day, so I was imagining conditions would not be good for Grandma’s in 2021. However, AccuWeather website is currently predicting a relatively cool, dry day in Duluth next Saturday (low 51, high 66)!
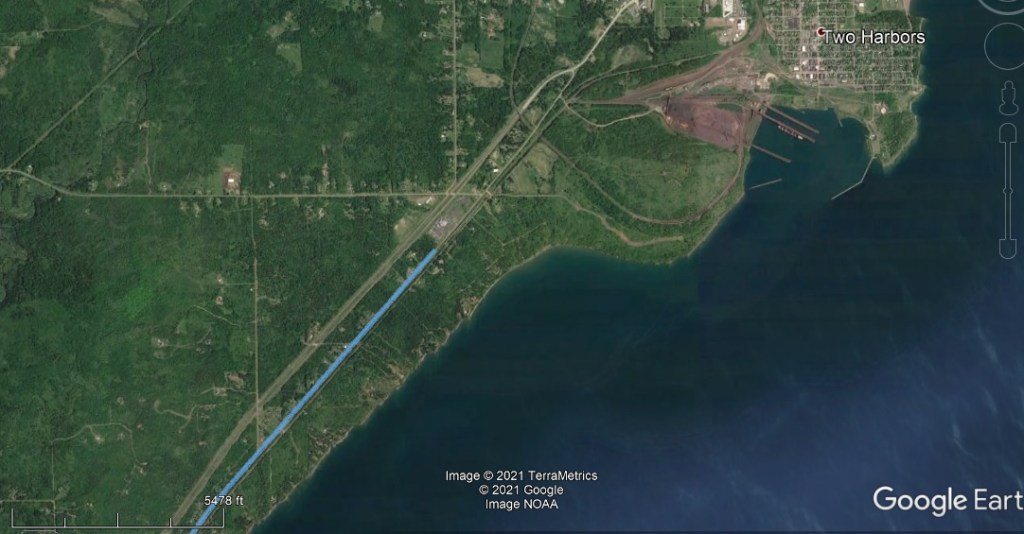
Pictures below show, as a blue line, the route of the marathon from the GPS data recorded by my running watch the last time I ran this race, superimposed on Google Earth images.
The first picture shows the marathon route from 44 miles up. Lake Superior looks like it must be a source of refreshing, cool breezes. You might think the route is like California’s famous Highway 1, with views of crashing waves on the (almost-an-ocean) Lake Superior shore and breezes cooled by the frigid waters.

Satellite view of Grandma’s Marathon route mapped on Google Earth. I used Google Search to look up whether it is alright to include these images in my blog posts. The answer I found was, “Generally speaking, as long as you’re following our Terms of Service and you’re attributing properly, you can use our maps and imagery. In fact, we love seeing creative applications of Google Maps, Google Earth and Street View.”
Methodology Note: This did not require any techno-wizardry on my part. Google Earth is a free computer program you can download (onto a laptop, tablet, or cellphone) that maps the whole earth by superimposing satellite images, aerial photography, and geographic data onto a geographic information system (“GIS”) in a way that allows the user to explore them by zooming in and out and changing angles of view. Google Earth is integrated with another Google creation, Street View, that allows you to look in any direction from a road-level perspective using images collected by a car mounted with 360-degree view camera on its roof. All I needed to do was drag the file saved by my Garmin watch (file extension, “gpx”) onto the open Google Earth program, which then automatically maps it. (Strava also uses these gpx files to create route maps and you can easily export a gpx file from Strava to your personal computer.) I think Google Earth provides a wonderful way to explore “where you were,” whether or not you use a gpx file!
The next picture is a lower altitude view of the start of marathon at the southern edge of Two Harbors, Minnesota. Here, as for most of the route, runners are one-half to one-quarter of a mile away from Lake Superior and cannot see it.
Grandma’s Marathon start line is at the southern edge of a Two Harbors car dealership lot (big rectangular slab of concrete that has new cars on it in this image but replaces the cars with porta-potties for Grandma’s. As part of the COVID-19 precautions, this year runners will be dropped off at the starting area by busload of 35, urged to keep moving then enter one of six marked, single-file lanes for the first part of the course.
The next two pictures are Street View images that give a taste of what runners see for miles and miles.
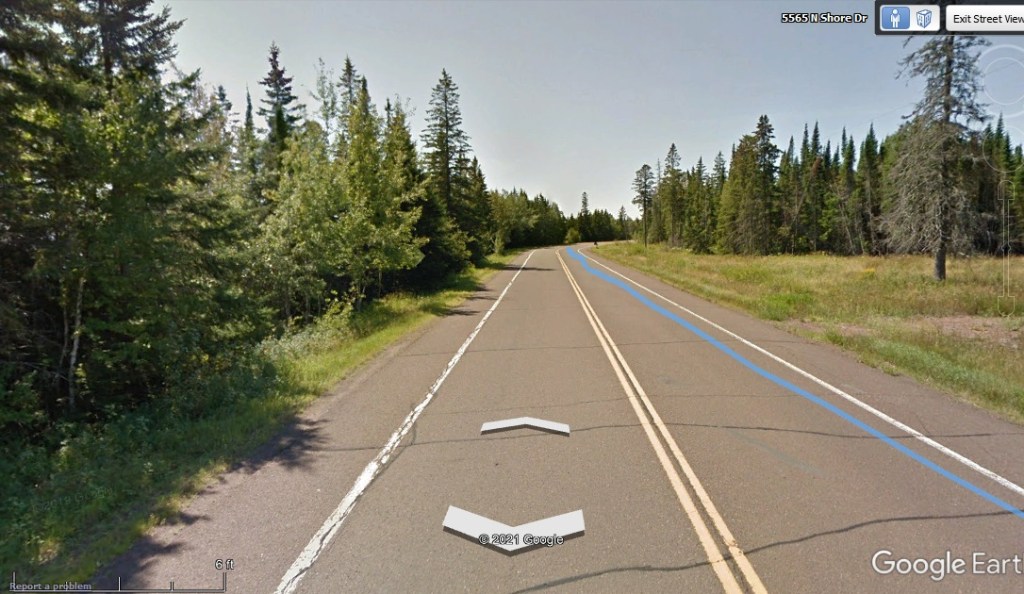
View heading southeast on Highway 61 towards Duluth. There are no views of crashing surf or sea lions basking along the shore. Note also that there is no shade! The first six or seven miles is subtly downhill, which you can tell by observing that treetops are lower ahead. Notice how I ran all the way over on the right side of the road because I can see the curve ahead and wanted to “run the tangents” for the shortest route to Duluth.
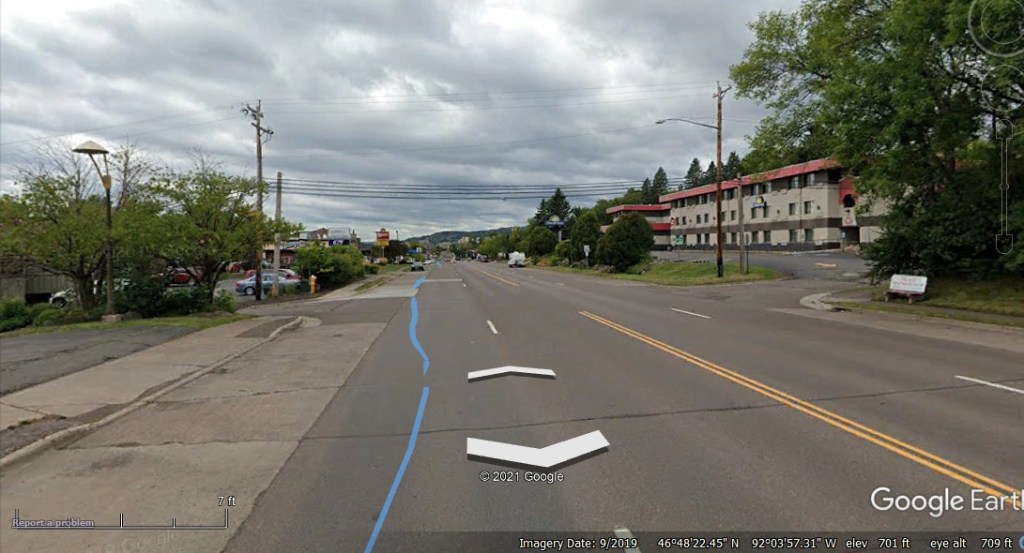
Things change when you eventually get into Duluth. The course widens to a major city street (here, London Road) and, in normal years, features many spectators. Here I am at about mile 22, passing the Days Inn Lakeview on the right. I recall that just after you pass this motel you can catch a view of the Aerial Liftbridge and finish area.
Eventually you get into downtown Duluth and begin hearing the PA system at the finish line. The end is not near as you may think, though, because the course doubles back a couple of times.
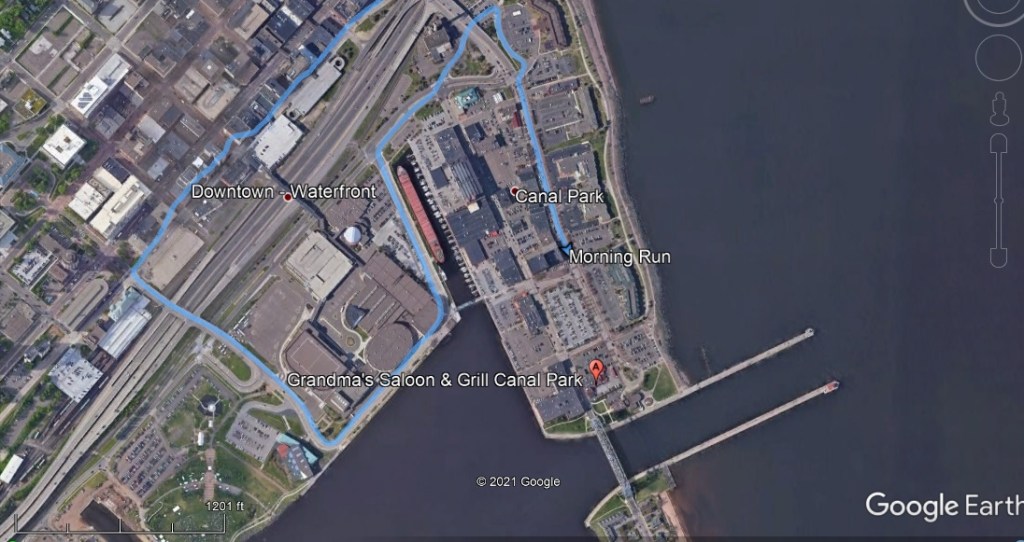
Many runners find the last part of route annoying because it goes past the finish area, then follows a long S-shape back around the Duluth Entertainment Convention Center (DECC) and past the (red colored) iron ore hauling ship (now museum), the William A. Irvin, before finally turning right onto Canal Park Drive towards the finish line.
Finally! The end and time to find a banana or two at the finish line refreshments table!
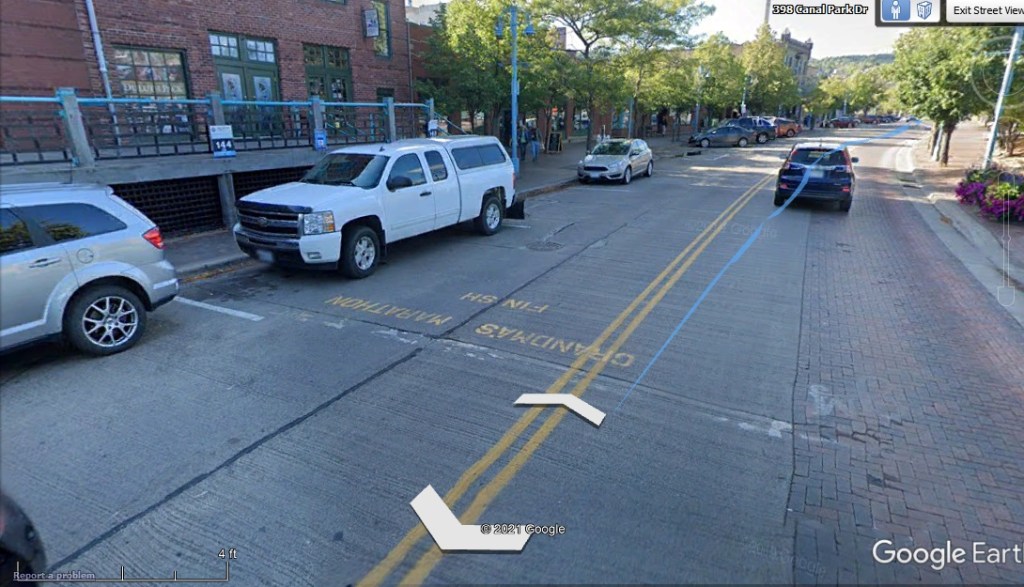
Here you see my last steps before stopping my running watch (which made the blue line end). Obviously, this Google Street View image was not captured during the marathon. On race day, the finish area is more elaborate than shown and has volunteers who hand out finisher medals and those mylar “space blankets” (if it is cold) and try to be ready to catch runners who fall due to their cerebral blood pressure dropping when they stop running (not a rare occurrence at the end of marathons). Also, I did not have to run up over the top of that car, which would be hard for me under the best of conditions and probably impossible at 26.2 miles!
If you kept going on Canal Park Drive you would cross the famous Aerial Lift Bridge:
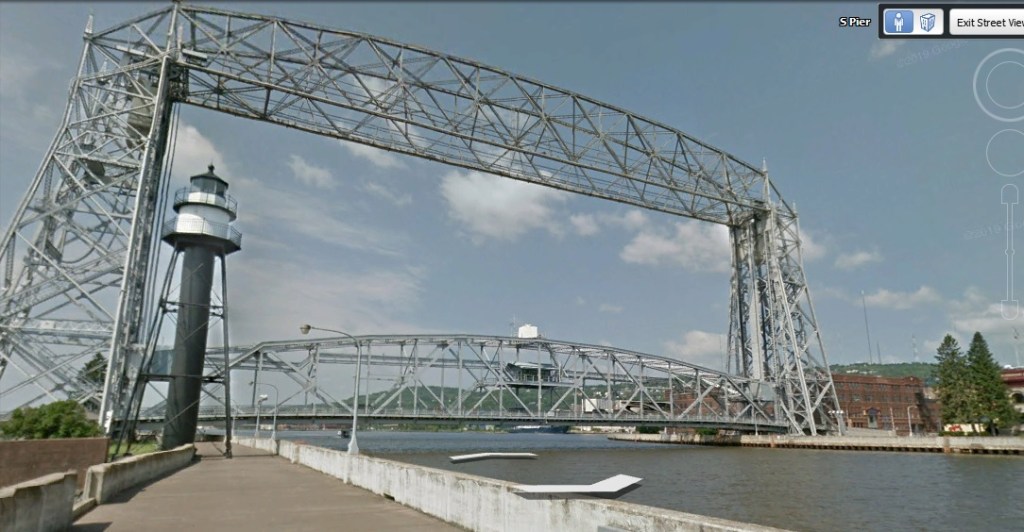
View of harbor entry under the Aerial Lift Bridge from the Superior, Wisconsin, side of the bridge. In the lower right corner (on Duluth side) is Grandma’s Saloon. This was chosen as the name for the race because Grandma’s restaurant was (only) sponsor in its first year (1977, 150 runners).
Individual runners vary a lot in how much they are affected by higher temperatures. A lot of this makes sense from basic principles. Smaller people have a higher ratio of body surface area to body mass and have an advantage when it comes to removing core heat. For example, I have often observed when larger male runners and smaller female runners run at the same pace in the summer, many of the males are dripping with sweat when the females show little or no evidence of sweating at all. However, there are clearly other factors.
I came across a “big data” analysis relevant to the upcoming Grandma’s Marathon, published by a group of researchers in France*. They combined the results from 60 marathons, ten years of results (2001 to 2010) from six major marathons (Paris, London, Berlin, Boston, Chicago, and New York), totaling almost 1.8 million finishing times, and the hourly temperature (and other environmental measures) for these marathons for the first four hours from gun start. They then identified the finishers whose time was the 99th, 75th, 50th, and 25th percentile in each race and modeled the relations between running speed for each gender and air temperature.
* This is an open access article that can be found at: https://tinyurl.com/5dn47xy9. Its authors suggest the following citation: El Helou N, Tafflet M, Berthelot G, Tolaini J, Marc A, et al. (2012) Impact of Environmental Parameters on Marathon Running Performance. PLoS ONE 7(5): e37407. doi:10.1371/journal.pone.0037407.
The most interesting results (to me) are in “Supplementary Table 3–Optimal temperatures for maximal running speeds of each level of performance, with speed losses associated with each temperature increase.” I made some conversions: added Fahrenheit temperature because Celsius does not mean as much to me (stupid American) and converted running speed in meters per second to mile paces in minutes and seconds and marathon finishing times in hours and minutes.
My first table shows what they determined to be the optimal temperature for running a marathon. It is probably no surprise that this is lower than any likely average temperature during Grandma’s Marthon.
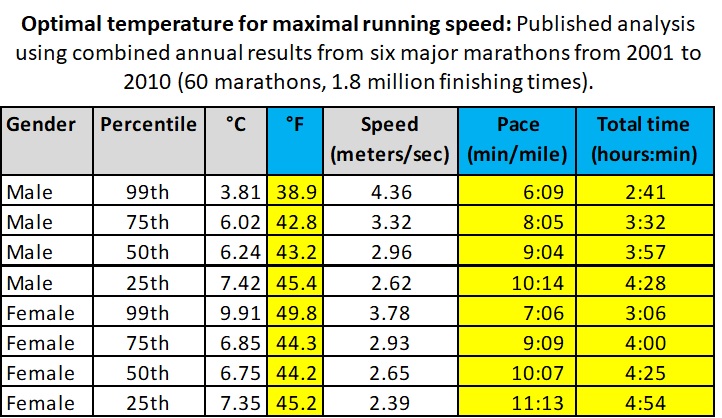
Adapted from results shown in supplementary table 3 of El Helou N, et al. Faster runners were found to have lower optimal temperatures for the marathon. (The one odd exception, 99th percentile females, is not discussed in the paper.)
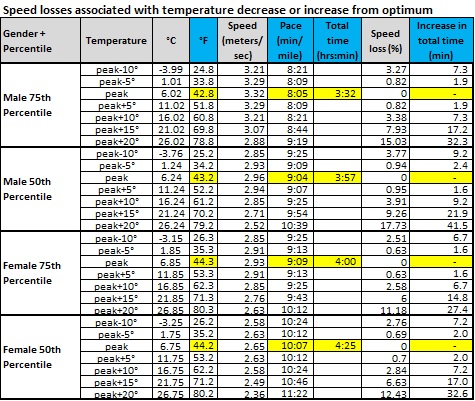
Supplementary Table 3 also shows their results for speed losses associated with temperature decrease or increase from optimum. I graphed these below for the 75th and 50th percentile males and females. The study would predict, for example, that a male with a 4:00 marathon at optimal temperature would be about 22 minutes slower if the average temperature was 70 degrees. A female with a 4:00 marathon at optimal temperature would be about 15 minutes slower at average temperature of 70 degrees.
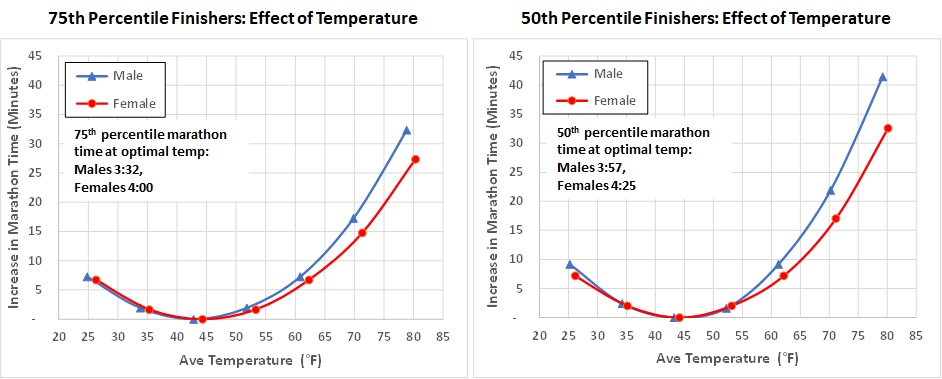
Adapted from results shown in supplementary table 3 of El Helou N, et al. Temperatures lower or higher than optimal were found to result in these increases in marathon time.
In case a table is easier to understand, here is the table I created prior to making the graph above:
Is anyone in Duluth thinking about the possibility of adding a “Winter Grandma’s Marathon? Would you consider running the Grandma’s route in, say, February, as climate change relentlessly raises year-round temperatures everywhere? (I would!) I think this would at the very least be a big hit in the media and could make a nice addition to the Duluth economy!

Leave a reply to Fashion Styles Cancel reply